Question: need properly explained solution of all Use an analysis-of-variance approach to test the hypothesis that , = 0 against the alternative hypothesis 3, = 0
need properly explained solution of all
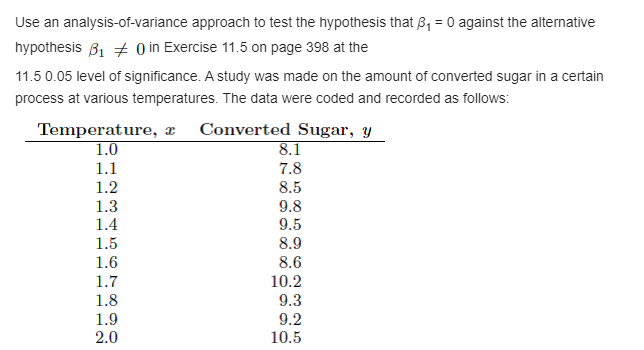
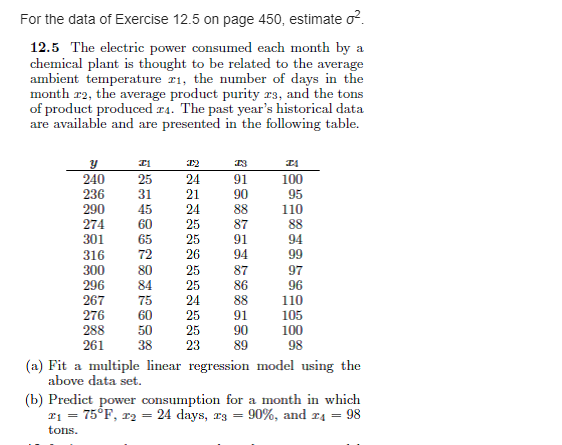
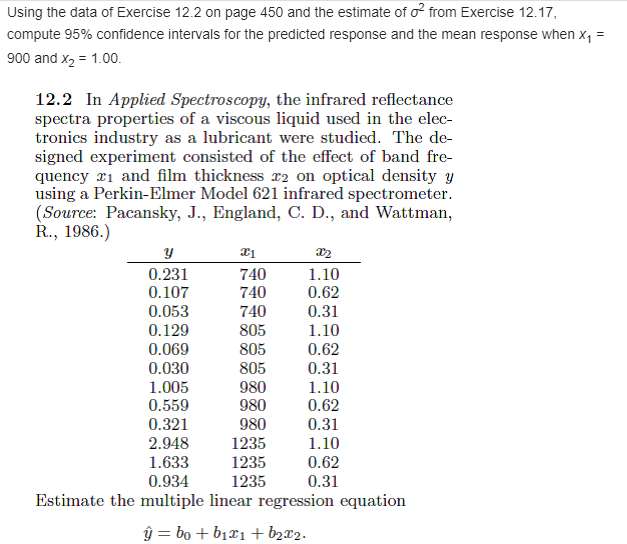
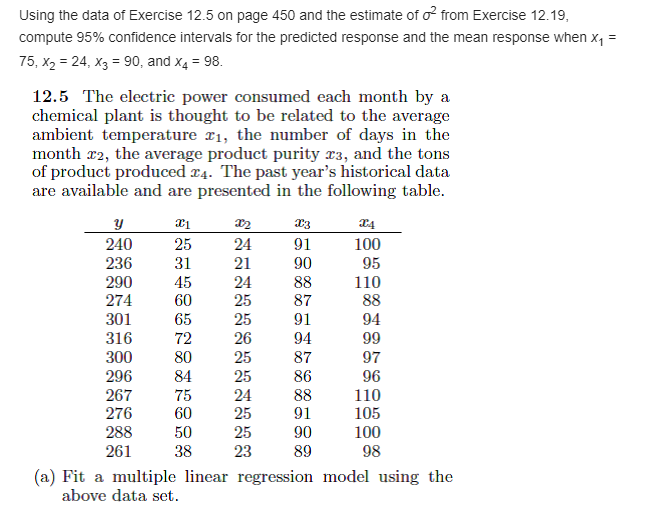
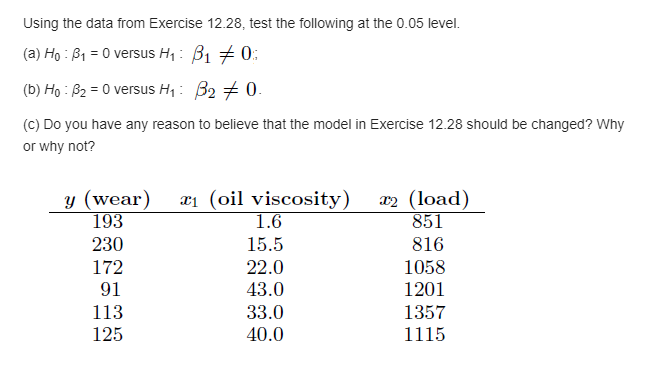
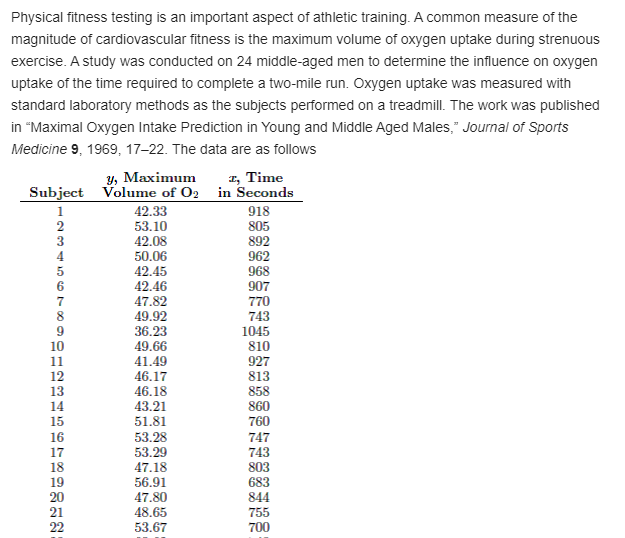
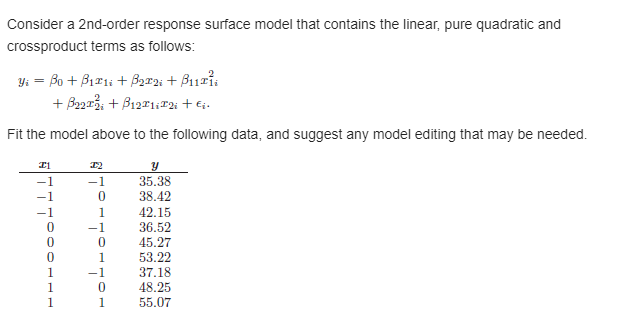
Use an analysis-of-variance approach to test the hypothesis that , = 0 against the alternative hypothesis 3, = 0 in Exercise 11.5 on page 398 at the 11.5 0.05 level of significance. A study was made on the amount of converted sugar in a certain process at various temperatures. The data were coded and recorded as follows: Temperature, a Converted Sugar, y 1.0 8.1 1.1 7.8 1.2 8.5 1.3 9.8 1.4 9.5 1.5 8.9 1.6 8.6 1.7 10.2 1.8 9.3 1.9 9.2 2.0 10.5For the data of Exercise 12.5 on page 45!], estimate 02. 12.5 The electric power consumed each month by a chemical plant is thought to be related to the average ambient temperature 1:1, the number of days in the month 22, the average product purity 1:3, and the tons of product produced 1'4. The past year's historical data are available and are presented in the nllnwing table. 1; 2:1 1*: Is 3:: 241} 25 2:1 91 11]] 236 31 21 QB 95 290 45 2:11- 33 11[II 2H ED 25 3'? 33 31111 65 25 91 9:1 316 22 26 9-1 99 em SD 25 3"! Q"? 296 34 25 BE 96 2E? 25 2:1 33 11[II WE 2E 91 105 238 5D 25 EU 11]] 261 IE 23 89 93 [a] Fit :1 multiple linear regression nrcdel using the abmre data set. [b] Predict power consumption for a nmoth in which 1'1 = \"35F, :3 = 24 days. :3 = 90%, and 1:4 = 93 tons. \fUsing the data at Exercise 12.5 on page 459 and the estimate 51' 02 Iron": Exercise 12.19, compute 95% condence intervals fortne predicted response and the mean response when x1 = r51 x2 = 24, x3 = so, and x4 = as. 12.5 The electric power consumed each month by a chemical plant is thought to he related to the average ambient temperature 1'1, the number of days in the month are, the average product purity.r 1:3, and the tons of product produced 1:4. The past year's historical data are available and are presented in the following table. y an as 2:3 2:4 249 25 24 91 199 235 31 21 99 95 299 45 24 88 119 2?4 59 25 37 83 391 55 25 91 94 315 T2 25 94 99 399 89 25 37 9? 295 84 25 35 95 25? T5 24 33 119 2?5 59 25 91 195 238 59 25 99 199 251 33 23 39 93 (a) Fit 3. multiple linear regression model using the above data set. \fPhysical tness testing is an important aspect of athletic training. A common measure of the magnitude of cardiovascular tness is the maximum yolume of oxygen uptake during strenuous exercise. A study was conducted on 24 middleaged men to determine the influence on oxygen uptake of the time required to complete a two-mile run. Oxygen uptake was measured with standard laboratory methods as the subjects performed on a treadmill. The work was published in \"Maximal Oxygen Intake Prediction in Young and Middle Aged Males,\" Journal of Sports Medicine 9, 1959, 1?22_ The data are as follows y, hiaxiumm 2:, Time Subject Vlum of Us in Seconds 1 42.33 9 13 3 53.19 395 3 42.93 392 4 59.96 962 5 42.45 963 6 42.46 99'? 'F 4?.32 1'79 8 49.92 743 9 36.23 1945 19 49.66 319 l l 41.49 92'? 12 46.1? 313 13 46.13 353 14 43.21 369 15 61.31 1'69 16 53.23 "f4? 1'? 53.29 743 18 4118 393 19 56.91 683 29 4139 344 31 43.65 T55 22 53.6? 31]} Consider a 2nd-order response surface model that contains the linear, pure quadratic and crossproduct terms as follows: 2 y. = n + .31311- + .3232.- + .31111a + .52421'5. + 31:31:12..- + Ea. Fit the model above to the followi ng data, and suggest an}:r model editing that may he needed. 1'1 1': y 1 l 35.33 1 l] 33.42 1 l 42.15 I] l 35.52 I] E] 45.2? I] l 53.22 1 l 3?.13 1 l] 43.25 1 1 55.0