

Question: Need questions 22-24 A company makes plastic cups. Four samples of 15 cups were taken from an ongoing process to establish a p chart for
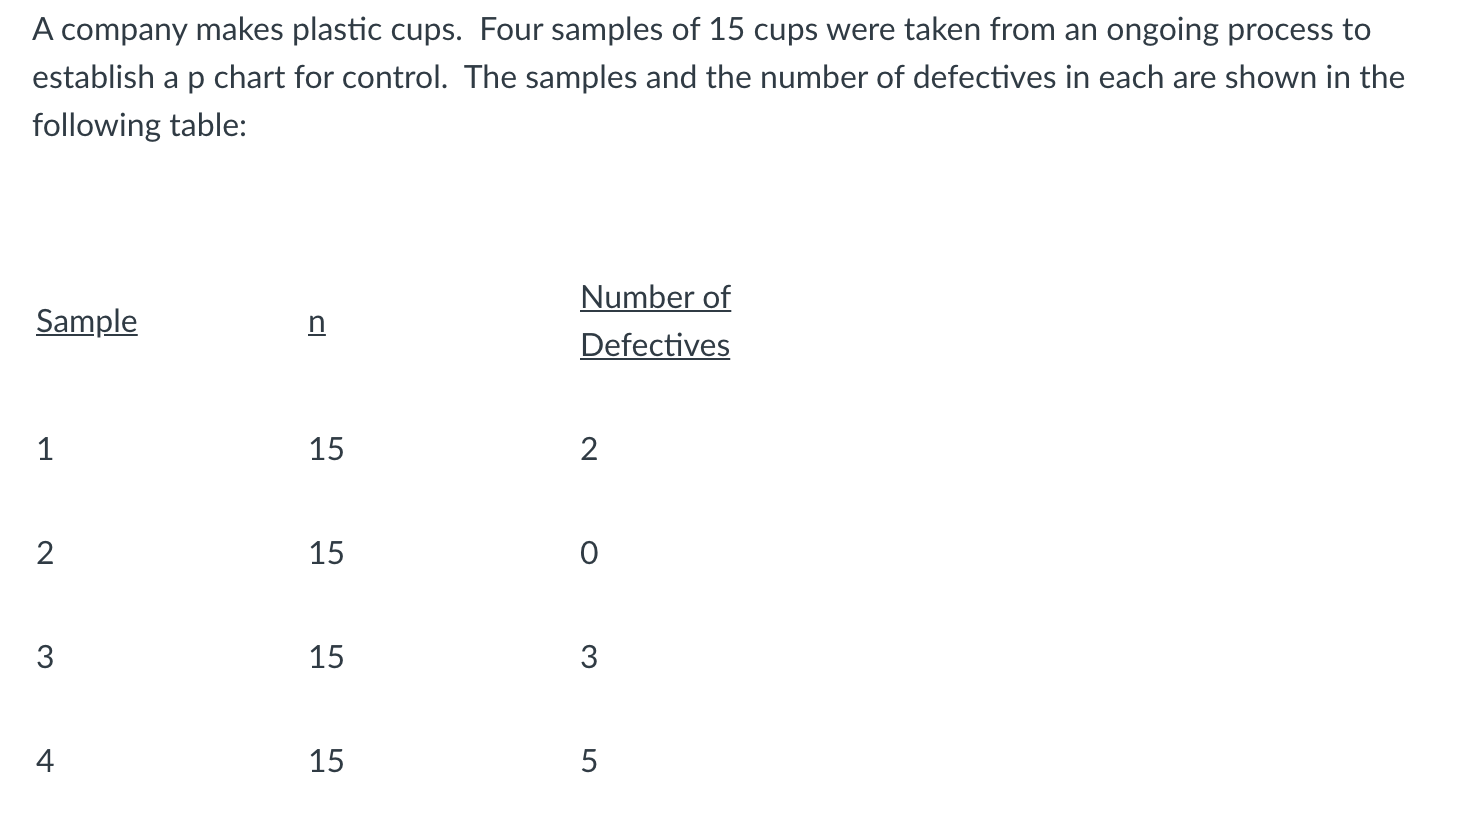
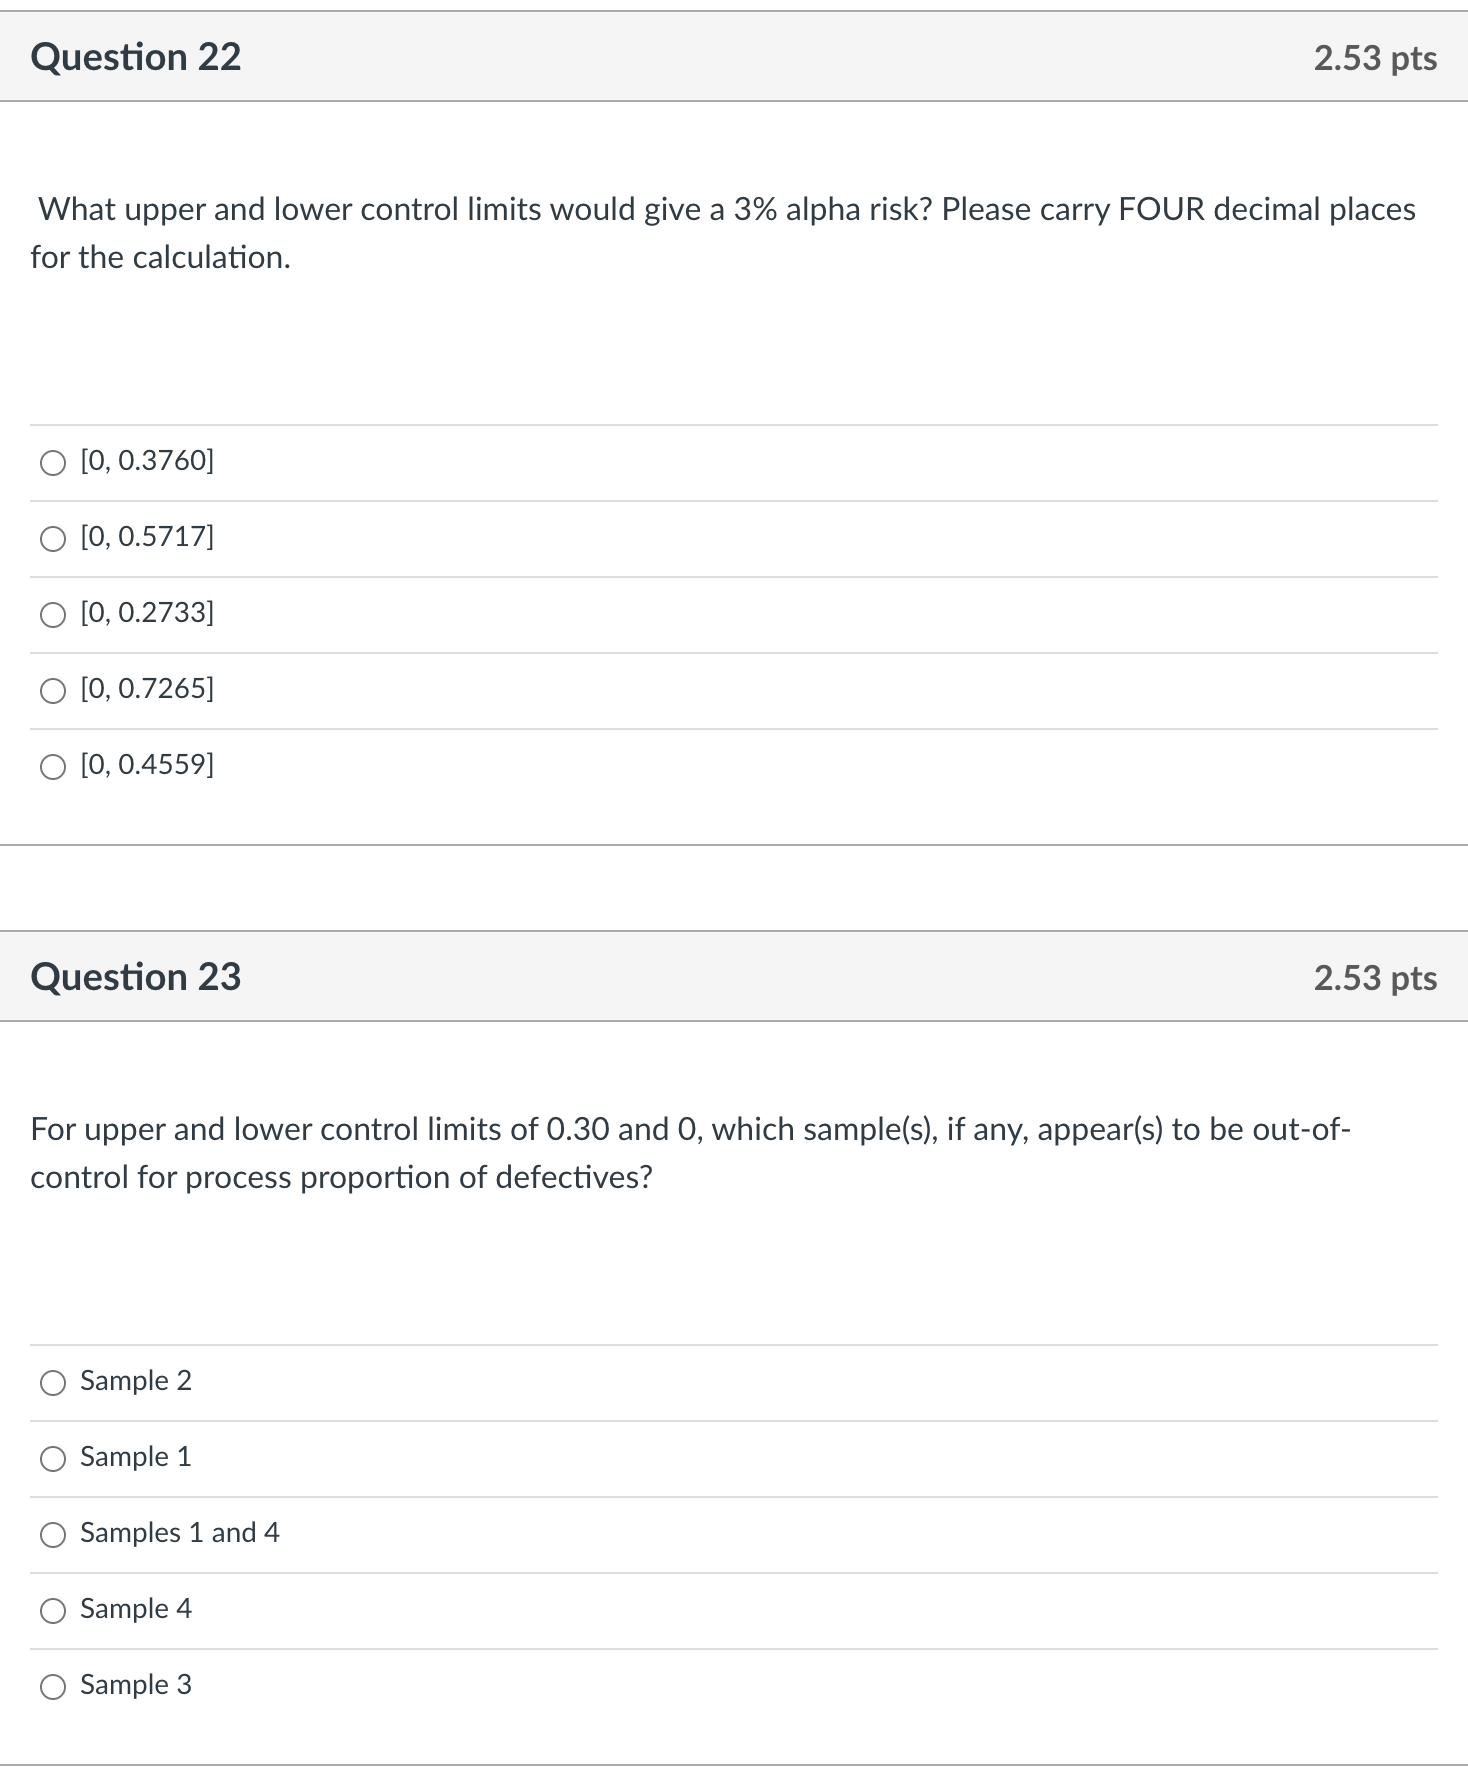
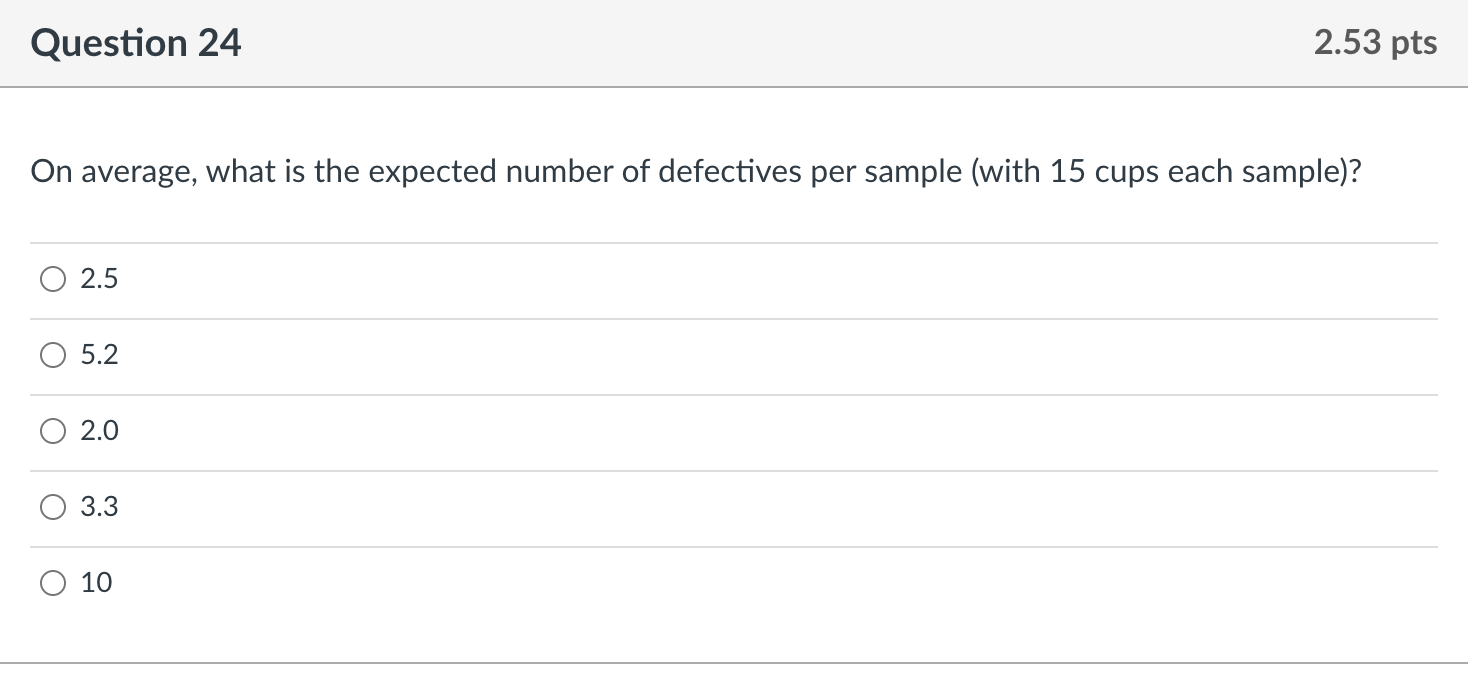 Need questions 22-24
Step by Step Solution
There are 3 Steps involved in it
1 Expert Approved Answer
Step: 1 Unlock

Question Has Been Solved by an Expert!
Get step-by-step solutions from verified subject matter experts
Step: 2 Unlock
Step: 3 Unlock