

Question: Need R code and explanation. Load the mpg data from the tidyverse package, and answer the following questions. a ) Using the color palette of
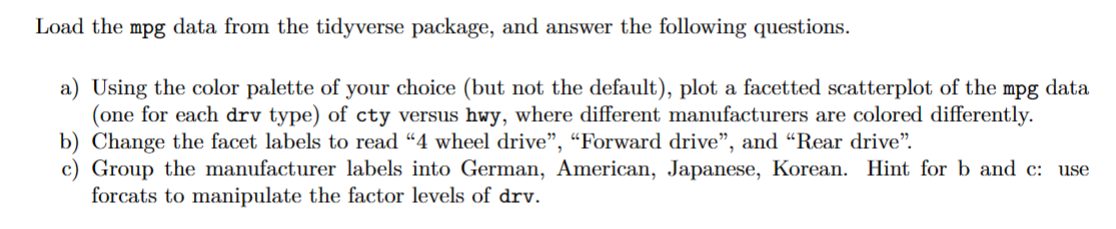
Need R code and explanation. Load the mpg data from the tidyverse package, and answer the following questions.
a Using the color palette of your choice but not the default plot a facetted scatterplot of the mpg data
one for each drv type of cty versus hwy where different manufacturers are colored differently.
b Change the facet labels to read wheel drive", "Forward drive", and "Rear drive".
c Group the manufacturer labels into German, American, Japanese, Korean. Hint for b and c: use
forcats to manipulate the factor levels of drv
Step by Step Solution
There are 3 Steps involved in it
1 Expert Approved Answer
Step: 1 Unlock

Question Has Been Solved by an Expert!
Get step-by-step solutions from verified subject matter experts
Step: 2 Unlock
Step: 3 Unlock