

Question: need solution for question a and b 3- Assessment: The data in datasheet ASSESSMENT gives the drying time T of a certain paint as a
need solution for question a and b 
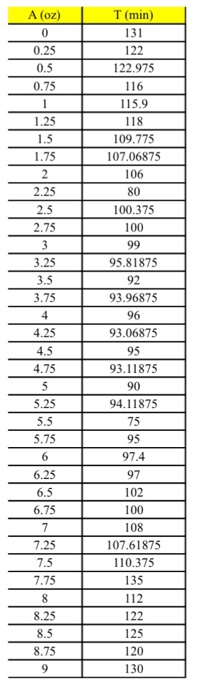
3- Assessment: The data in datasheet ASSESSMENT gives the drying time T of a certain paint as a function of the amount of a certain additive A. (a) Among first-, second-, third-, and fourth-degree polynomials, find the best function that fits the data. Why do you think this function is the best fitting function? Discuss the quality of the curve fit statistically (plot R-Square values in a bar graph) and graphically (plot residuals in a 2 by 2 subplot). (b) How can you improve the quality of the best fit? (Hint: Exclusion of which data point(s) can improve the fit? How much can you improve R-square value this way?)
Step by Step Solution
There are 3 Steps involved in it
1 Expert Approved Answer
Step: 1 Unlock

Question Has Been Solved by an Expert!
Get step-by-step solutions from verified subject matter experts
Step: 2 Unlock
Step: 3 Unlock