

Question: need some help pls The following data represent the pH of rain for a random sample of 12 rain dates. A normal probability plot suggests
need some help pls
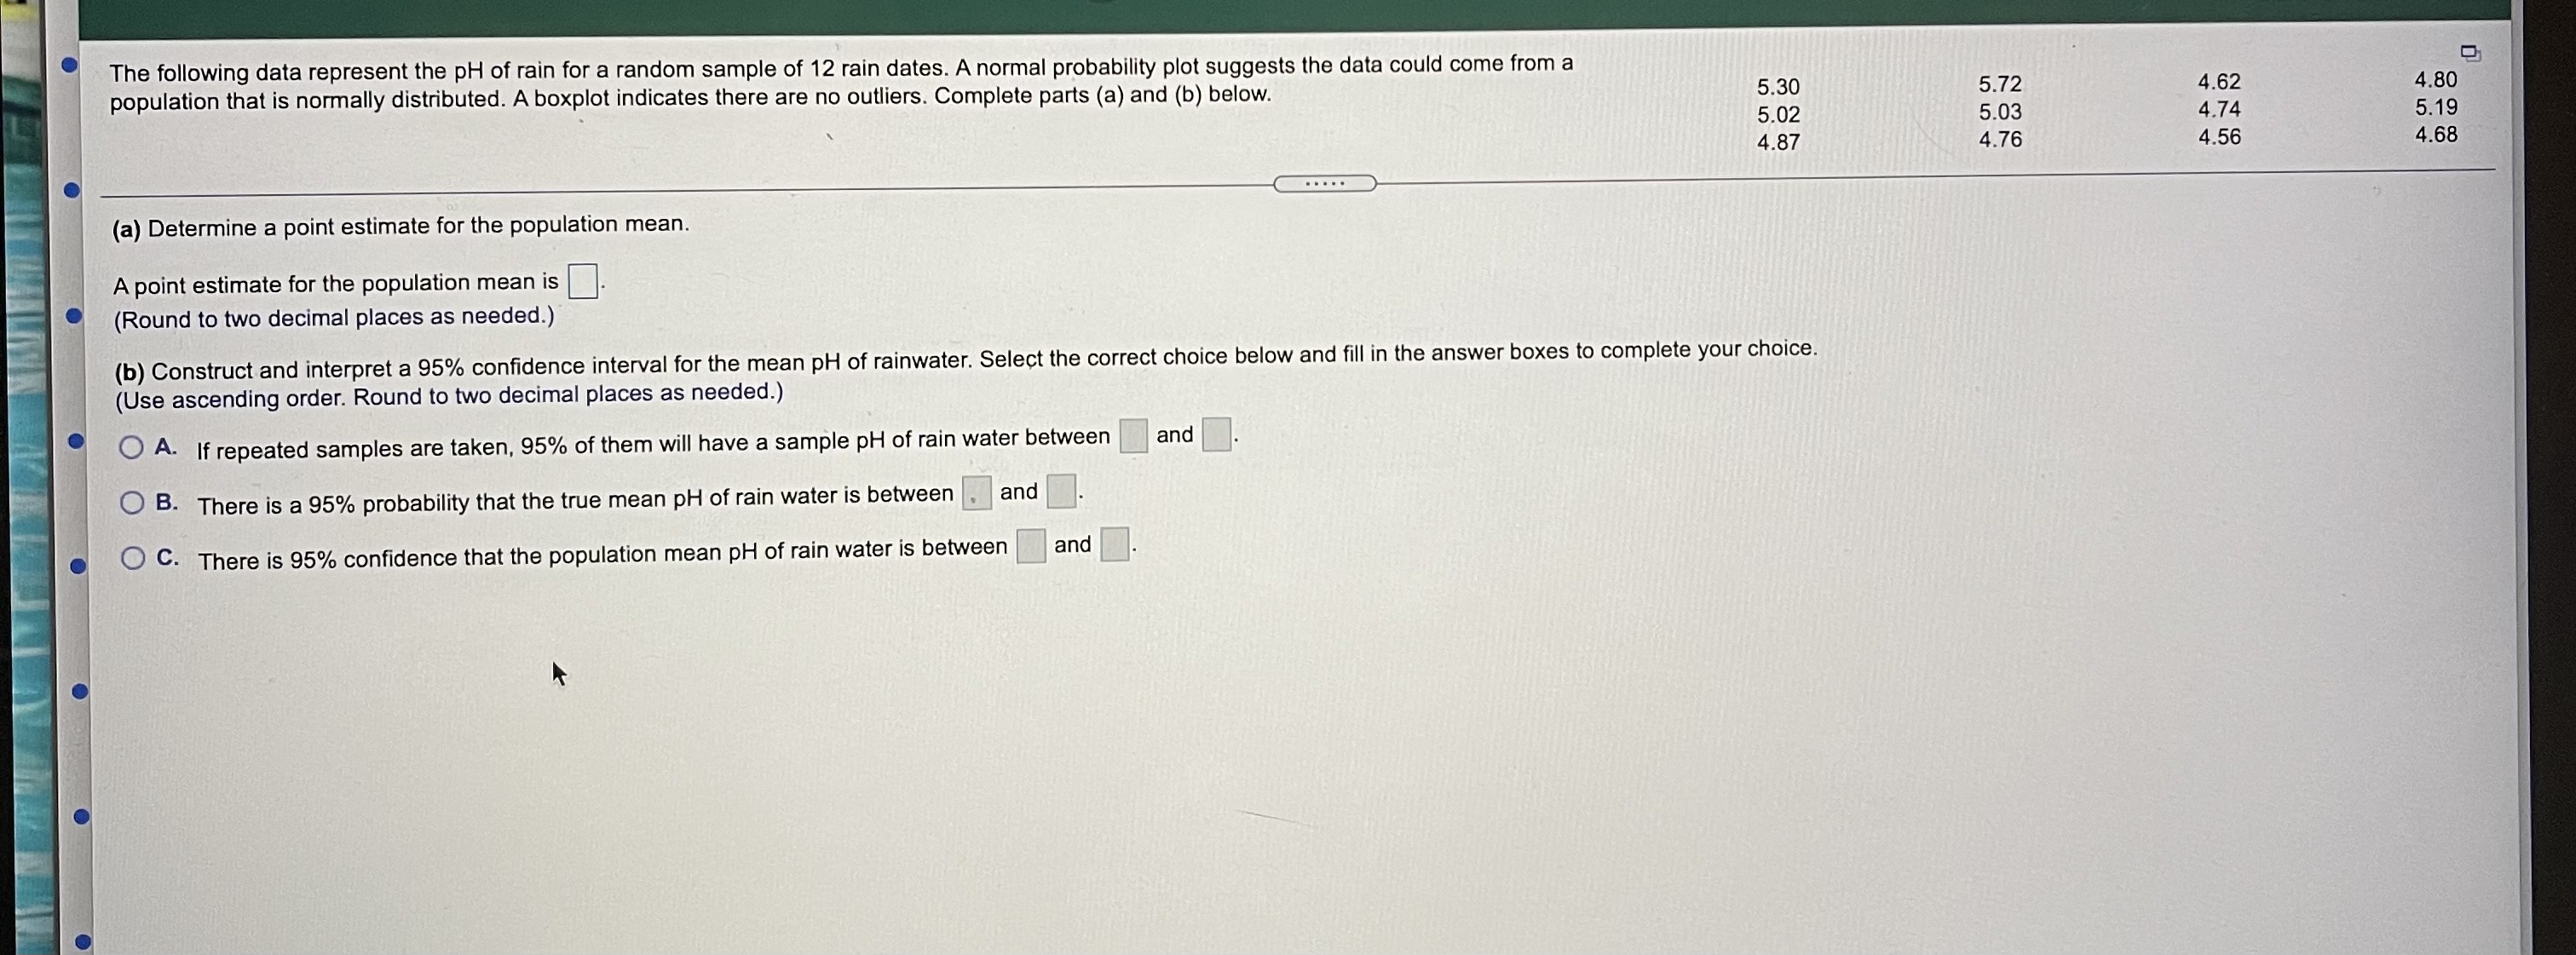
The following data represent the pH of rain for a random sample of 12 rain dates. A normal probability plot suggests the data could come from a population that is normally distributed. A boxplot indicates there are no outliers. Complete parts (a) and (b) below. 5.30 5.72 4.62 4.80 5.02 5.03 4.74 5.19 4.87 4.76 4.56 4.68 (a) Determine a point estimate for the population mean. A point estimate for the population mean is Round to two decimal places as needed.) (b) Construct and interpret a 95% confidence interval for the mean pH of rainwater. Select the correct choice below and fill in the answer boxes to complete your choice. (Use ascending order. Round to two decimal places as needed.) O A. If repeated samples are taken, 95% of them will have a sample pH of rain water between and O B. There is a 95% probability that the true mean pH of rain water is between . and O C. There is 95% confidence that the population mean pH of rain water is between and
Step by Step Solution
There are 3 Steps involved in it

Get step-by-step solutions from verified subject matter experts