

Question: Need some help Question 6 (Essay Worth 10 points) (01.02 MC} The following table shows the number of hours some high school students in two
Need some help
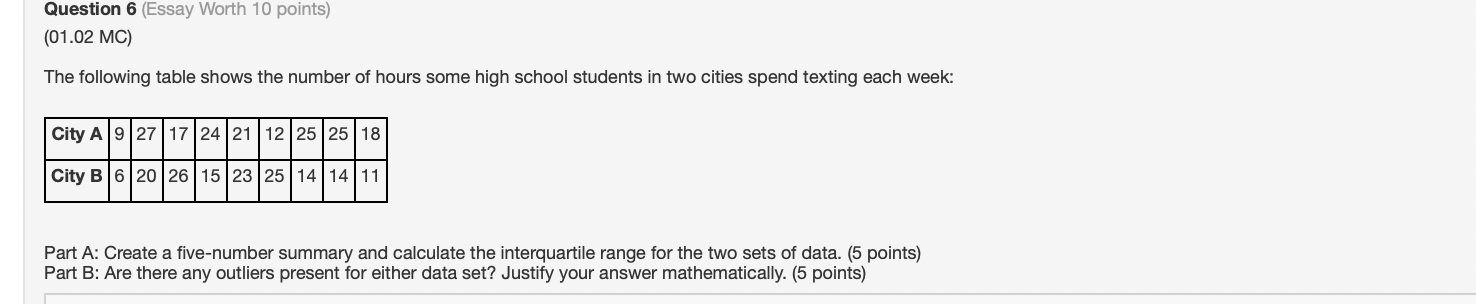
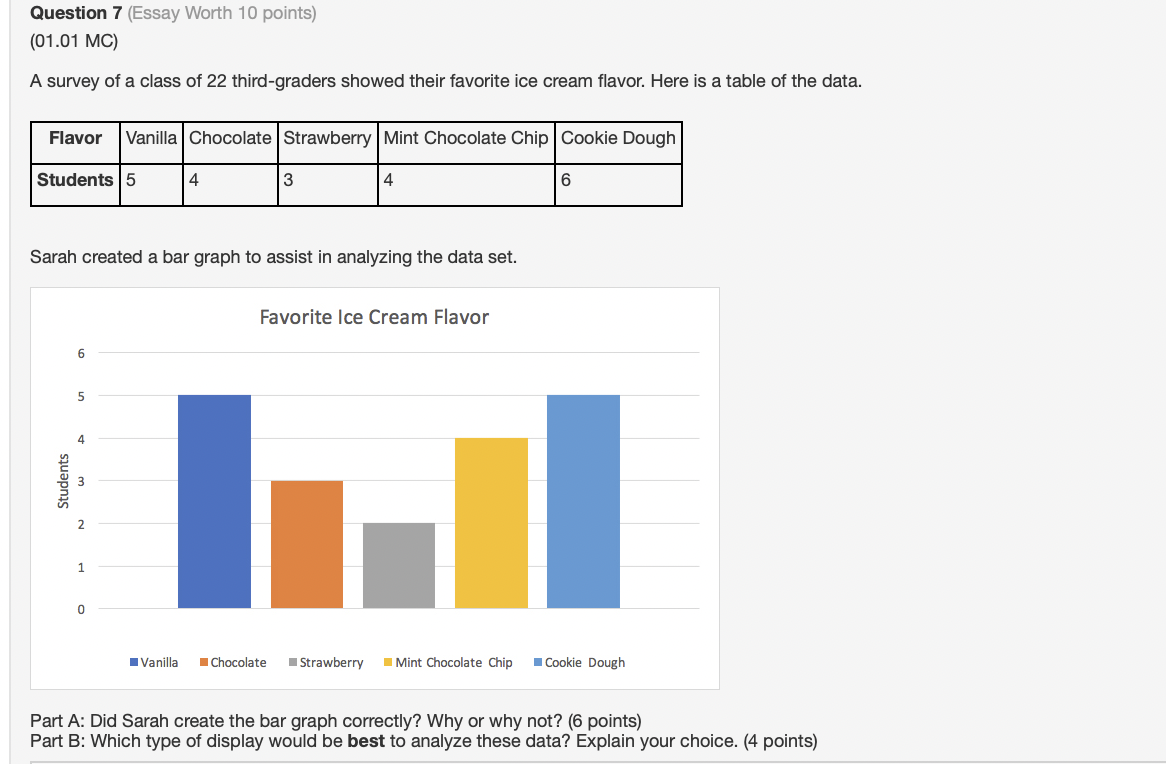
Question 6 (Essay Worth 10 points) (01.02 MC} The following table shows the number of hours some high school students in two cities spend texting each week: \"\"HHEHHHEEH \"w Part A: Create a ve-number summary and calculate the interquanile range for the two sets of data. (5 points) Part B: Are there any outliers present for either data set? Justify your answer mathematically. (5 points) Question 7 (Essay Worth 10 points) (01.01 MC) A survey of a class of 22 third-graders showed their favorite ice cream flavor. Here is a table of the data. Flavor Vanilla | Chocolate | Strawberry | Mint Chocolate Chip | Cookie Dough Students 5 4 3 4 6 Sarah created a bar graph to assist in analyzing the data set. Favorite Ice Cream Flavor un Students W N I Vanilla Chocolate Strawberry = Mint Chocolate Chip Cookie Dough Part A: Did Sarah create the bar graph correctly? Why or why not? (6 points) Part B: Which type of display would be best to analyze these data? Explain your choice. (4 points)
Step by Step Solution
There are 3 Steps involved in it

Get step-by-step solutions from verified subject matter experts