

Question: Need some help with stats problems please .. Thanks! Questions are numbered 10 WEBBWWW questron. A sample of 16 items provides a sample standard deviation
Need some help with stats problems please .. Thanks! Questions are numbered
10
![variance is greater than 5|]. 0 Reject H0. We conclude that the](https://s3.amazonaws.com/si.experts.images/answers/2024/07/668632ee67dd2_894668632ee322ed.jpg)
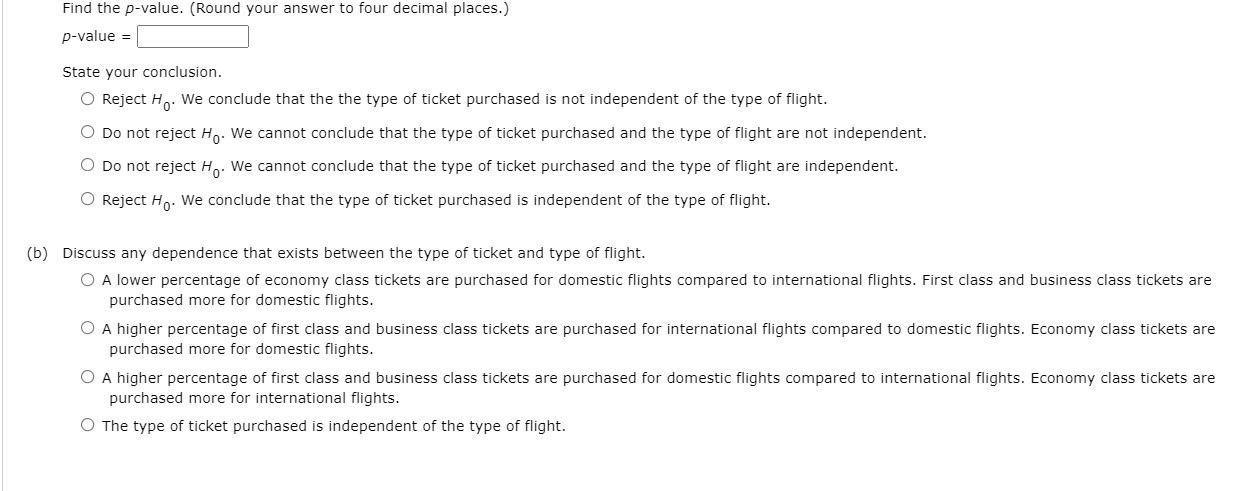
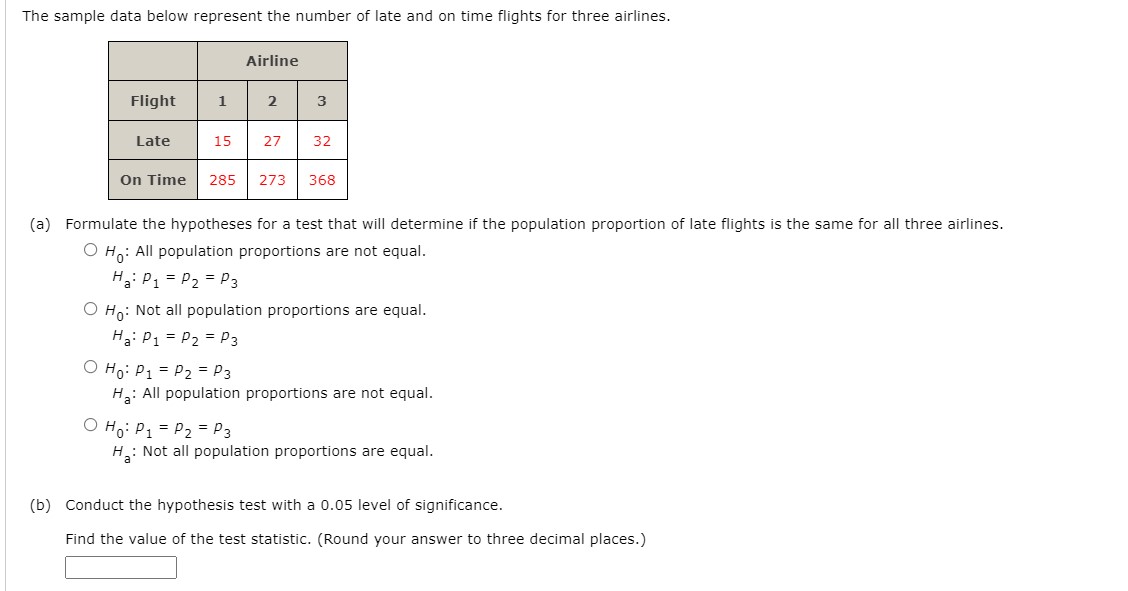
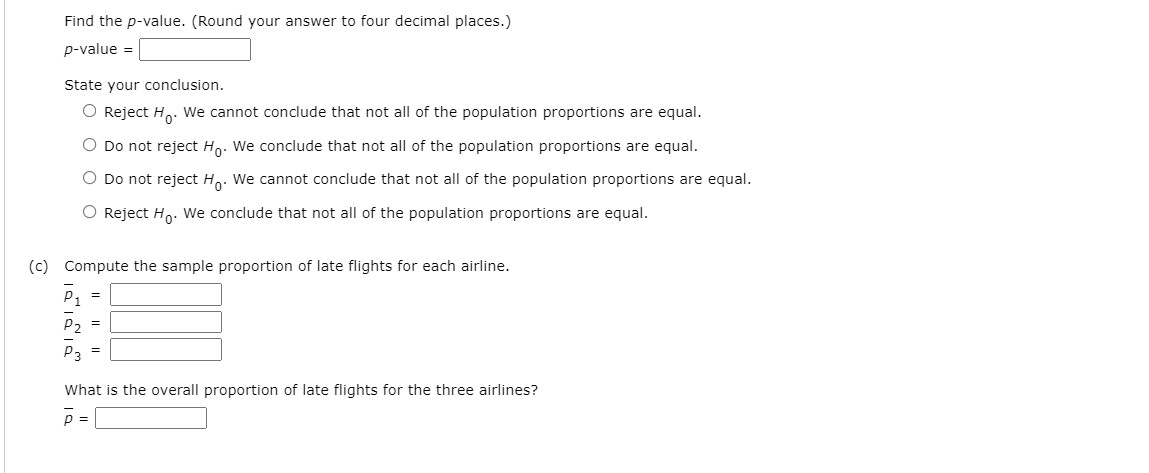
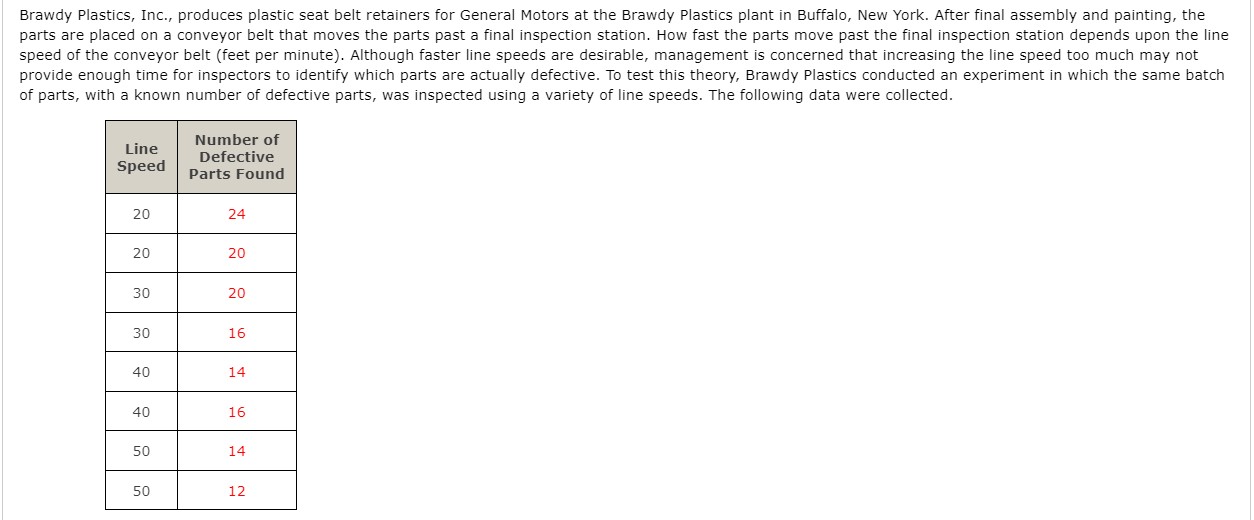
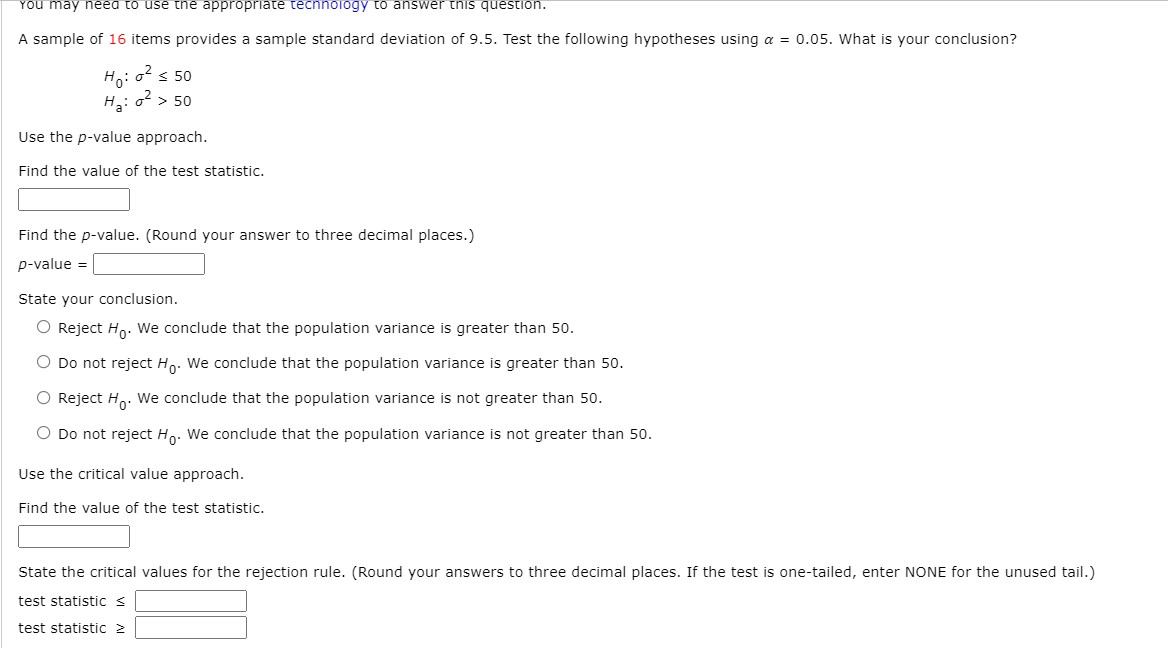
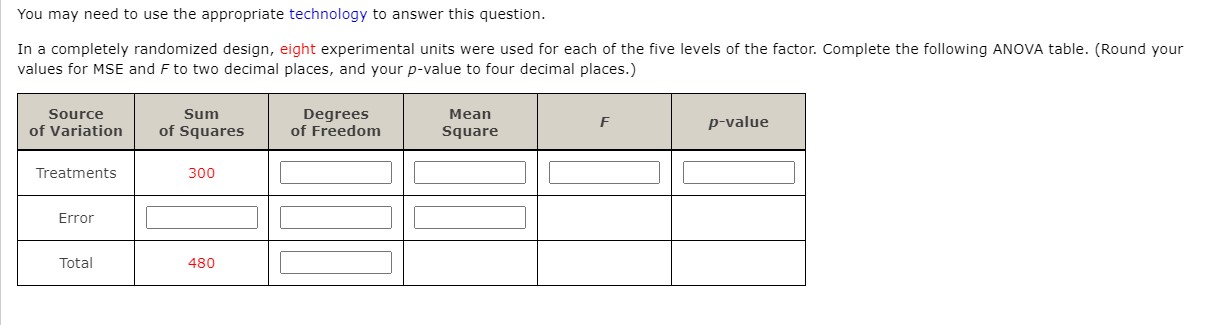
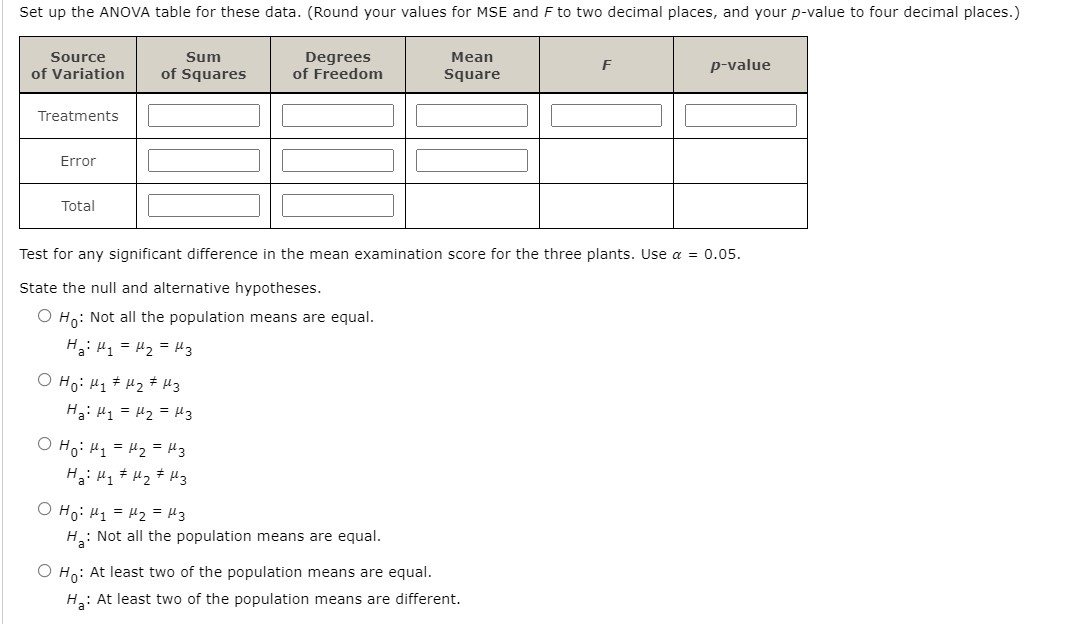
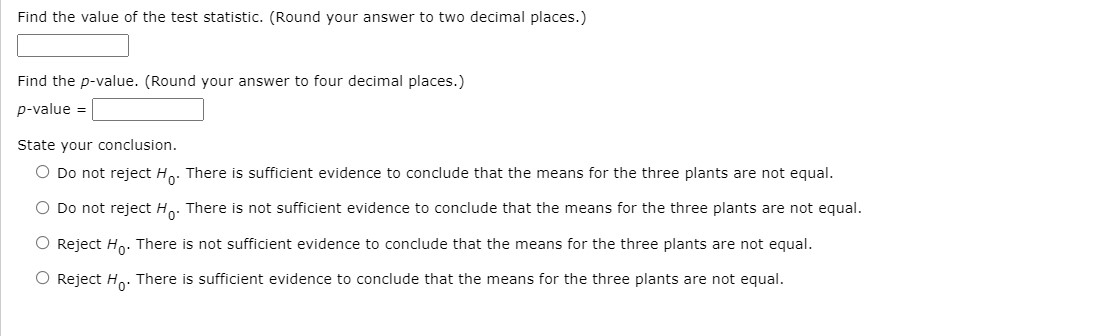
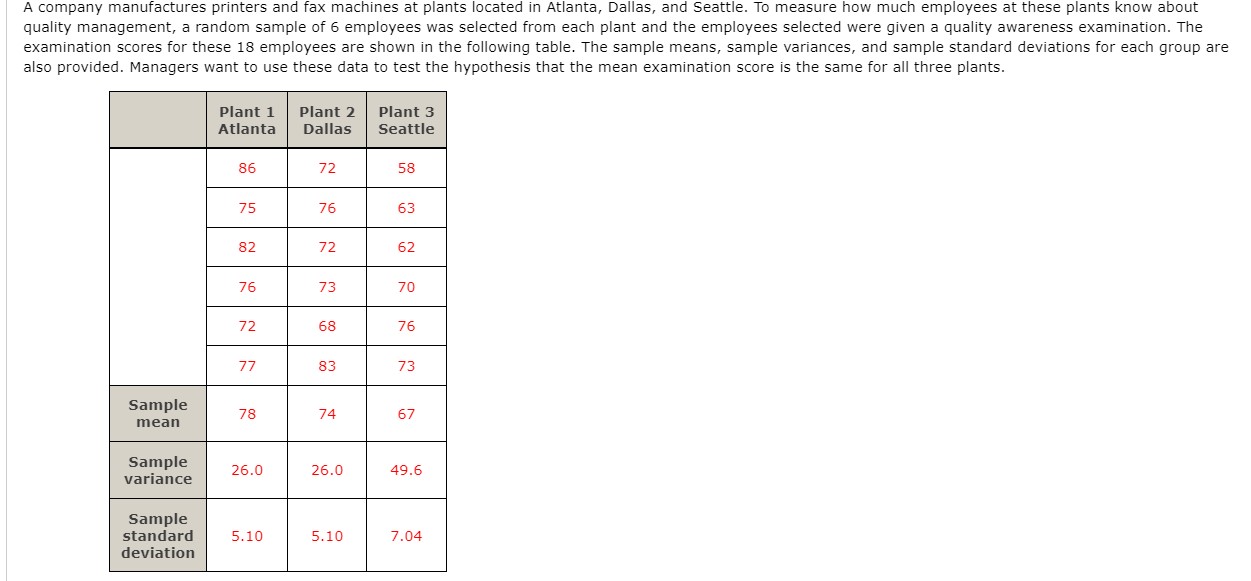
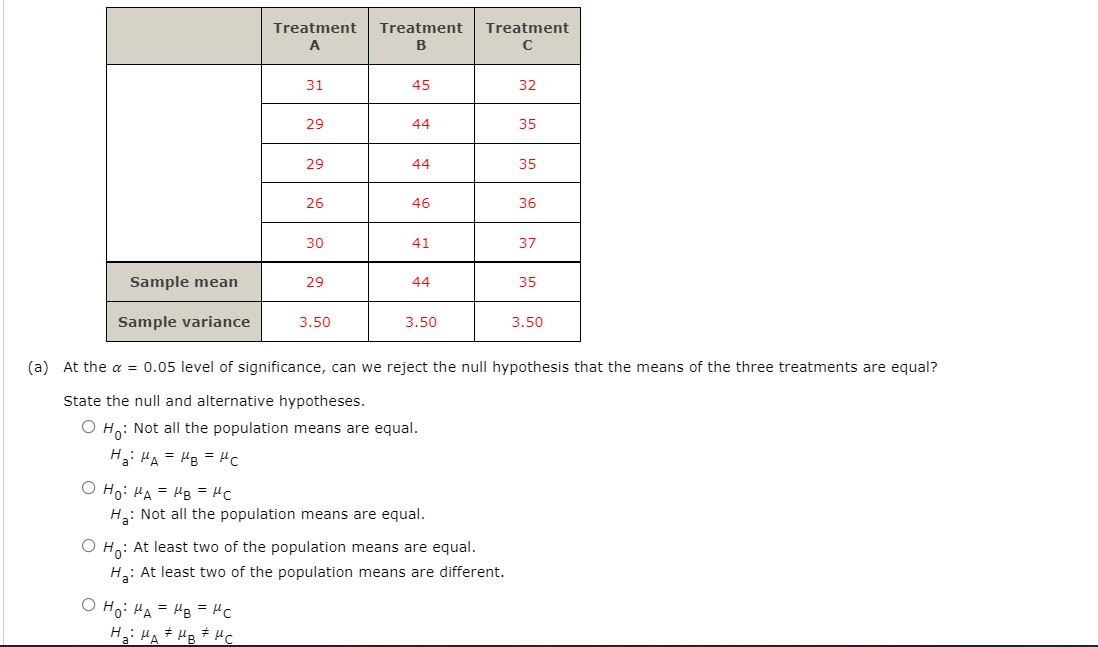
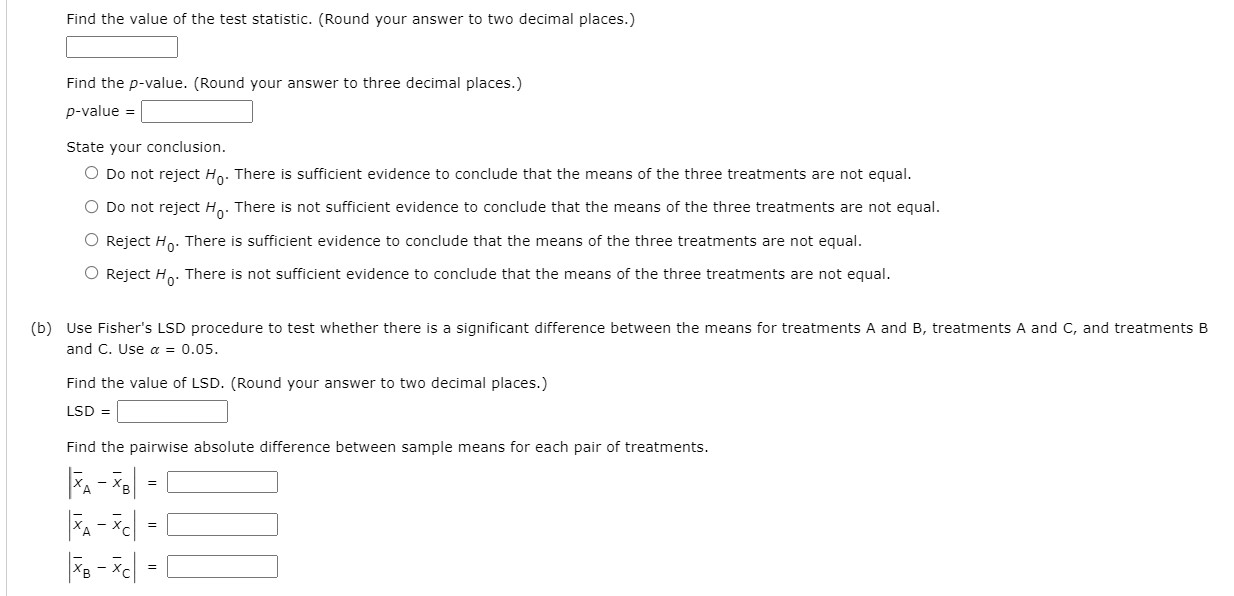
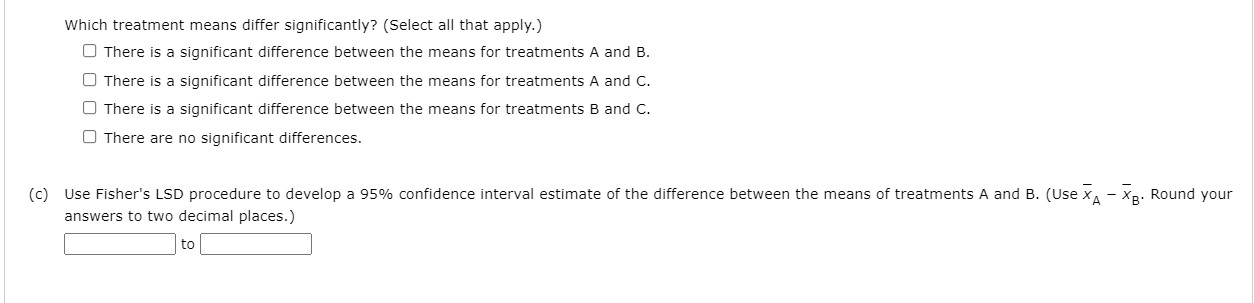
WEBBWWW questron. A sample of 16 items provides a sample standard deviation of 9.5. Test the following hypotheses using a = 0.05. What is your conclusion? H0: 02 s so . 2 Ha. (I > 50 Use the pvalue approach. Find the value of the test statistic. E Find the pvalue. (Round your answer to three decimal places.) State your conclusion. 0 Reject H0. We conclude that the population variance is greater than 50. 0 Do not reject H0. We conclude that the population variance is greater than 5|]. 0 Reject H0. We conclude that the population variance is not greater than 50. 0 Do not reject \"'0' We conclude that the population variance is not greater than 50. Use the critical value approach. Find the value of the test statistic. E State the critical values for the rejection rule. (Round your answers to three decimal places. If the test is one-tailed, enter NONE for the unused tail.) test statistic \\:| test statistic 2 E IA You may need to use the appropriate technology to answer this question. In a completely randomized design, eight experimental units were used for each of the ve levels of the factor. Complete the following ANOVA table. (Round your values for MSE and Fto two decimal places, and your pvalue to four decimal places.) Treatments 300 I I I I I I I Error l | | | | an E Set up the ANUVA table for these data. (Round your values for MSE and Fto two decimal places, and your pvalue to four decimal places.) Treatments l l l l l Em" | || || | Total I I I I Test for any signicant difference in the mean examination score for the three plants. Use a = [1.05. State the null and alternative hypotheses. O Ho: Not all the population means are equal. Ha: \"1 = \"2 = #3 O Ho:p1#p2##3 Ha: #1 = #2 = #3 O Ho:#1 2-\"22-"3 Ha: #1 if #2 55 #3 O \"03% =F'22F'3 Ha: Not all the population means are equal. 0 Ho: At least two of the population means are equal. Ha: At least two of the population means are different. Find the value of the test statistic. (Round your answer to two decimal places.) E Find the pvalue. (Round your answer to four decimal places.) State your conclusion. 0 Do not reject H0. There is sufficient evidence to conclude that the means for the three plants are not equal. 0 Do not reject H0. There is not sufcient evidence to conclude that the means for the three plants are not equal. 0 Reject HO. There is not sufficient evidence to conclude that the means for the three plants are not equal. 0 Reject HO. There is sufcient evidence to conclude that the means for the three plants are not equal. A company manufactures printers and fax machines at plants located in Atlanta, Dallas, and Seattle. To measure how much employees at these plants know about quality management, a random sample of 6 employees was selected from each plant and the employees seletied were given a quality awareness examination. The examination scores for these 18 employees are shown in the following table. The sample means, sample variances, and sample standard deviations for each group are also provided. Managers want to use these data to test the hypothesis that the mean examination score is the same for all three plants. (a) At the a = 0.05 level of signicance, can we reject the null hypothesis that the means of the three treatments are equal? State the null and alternative hypotheses. 0 Ho: Not all the population means are equal. Ha: \"A = \"B = \"c 0 Ho: l\"A21\"|=_'.=l\"c Ha: Not all the population means are equal. 0 HD: At least two of the population means are equal. Ha: At least two of the population means are different. 0 Ho: \"A=-\"B=-\"c Ha: HA # #B # pic Find the value of the test statistic. (Round your answer to two decimal places.) Find the p-value. (Round your answer to three decimal places.) p-value = State your conclusion. O Do not reject Ho. There is sufficient evidence to conclude that the means of the three treatments are not equal. O Do not reject Ho. There is not sufficient evidence to conclude that the means of the three treatments are not equal. O Reject Ho. There is sufficient evidence to conclude that the means of the three treatments are not equal. O Reject H . There is not sufficient evidence to conclude that the means of the three treatments are not equal. (b) Use Fisher's LSD procedure to test whether there is a significant difference between the means for treatments A and B, treatments A and C, and treatments B and C. Use a = 0.05. Find the value of LSD. (Round your answer to two decimal places.) LSD = Find the pairwise absolute difference between sample means for each pair of treatments. XA - X B = X A - XC = X B - XC =Which treatment means differ significantly? (Select all that apply.) O There is a significant difference between the means for treatments A and B. O There is a significant difference between the means for treatments A and C. O There is a significant difference between the means for treatments B and C. O There are no significant differences. (c) Use Fisher's LSD procedure to develop a 95% confidence interval estimate of the difference between the means of treatments A and B. (Use X - XB. Round your answers to two decimal places.) toA magazine subscriber study asked, "In the past 12 months, when traveling for business, what type of airline ticket did you purchase most often?" A second question asked if the type of airline ticket purchased most often was for domestic or international travel. Sample data obtained are shown in the following table. Type of Flight Type of Ticket Domestic International First class 24 17 Business class 100 126 Economy class 518 135 (a) Using a 0.05 level of significance, is the type of ticket purchased independent of the type of flight? State the null and alternative hypotheses. O H: The type of ticket purchased is not independent of the type of flight. Ha: The type of ticket purchased is independent of the type of flight. O Ho: The type of ticket purchased is mutually exclusive from the type of flight. He: The type of ticket purchased is not mutually exclusive from the type of flight. O Ho: The type of ticket purchased is independent of the type of flight. Ha: The type of ticket purchased is not independent of the type of flight. O Ho: The type of ticket purchased is not mutually exclusive from the type of flight. H,: The type of ticket purchased is mutually exclusive from the type of flight. Find the value of the test statistic. (Round your answer to three decimal places.)Find the p-value. (Round your answer to four decimal places.) p-value = State your conclusion. O Reject Ho. We conclude that the the type of ticket purchased is not independent of the type of flight. O Do not reject Ho. We cannot conclude that the type of ticket purchased and the type of flight are not independent. O Do not reject H . We cannot conclude that the type of ticket purchased and the type of flight are independent. O Reject Ho. We conclude that the type of ticket purchased is independent of the type of flight. (b) Discuss any dependence that exists between the type of ticket and type of flight. O A lower percentage of economy class tickets are purchased for domestic flights compared to international flights. First class and business class tickets are purchased more for domestic flights. O A higher percentage of first class and business class tickets are purchased for international flights compared to domestic flights. Economy class tickets are purchased more for domestic flights. O A higher percentage of first class and business class tickets are purchased for domestic flights compared to international flights. Economy class tickets are purchased more for international flights. O The type of ticket purchased is independent of the type of flight.The sample data below represent the number of late and on time flights for three airlines. Airline Flight 1 2 3 Late 15 27 32 On Time 285 273 368 (a) Formulate the hypotheses for a test that will determine if the population proportion of late flights is the same for all three airlines. O H: All population proportions are not equal. HA: P1 = P2 = P3 O Ho: Not all population proportions are equal. Ha: P1 = P2 = P3 O Ho: P1 = P2 = P3 H.: All population proportions are not equal. OH: P1 = P2 = P3 He: Not all population proportions are equal. (b) Conduct the hypothesis test with a 0.05 level of significance. Find the value of the test statistic. (Round your answer to three decimal places.)Find the pvalue. (Round your answer to four decimal places.) State your conclusion. 0 Reject HO. We cannot conclude that not all of the population proportions are equal. 0 Do not reject H0. We conclude that not all of the population proportions are equal. 0 Do not reject H0. We cannot conclude that not all of the population proportions are equal. 0 Reject H0. We conclude that not all of the population proportions are equal. (c) Compute the sample proportion of late ights for each airline. 9] = : p2 = E p3 = E what is the overall proportion of late ights for the three airlines? 5:: Brawdy Plastics, Inc., produces plastic seat belt retainers for General Motors at the Brawdy Plastics plant in Buffalo, New York. After final assembly and painting, the parts are placed on a conveyor belt that moves the parts past a final inspection station. How fast the parts move past the final inspection station depends upon the line speed of the conveyor belt (feet per minute). Although faster line speeds are desirable, management is concerned that increasing the line speed too much may not provide enough time for inspectors to identify which parts are actually defective. To test this theory, Brawdy Plastics conducted an experiment in which the same batch of parts, with a known number of defective parts, was inspected using a variety of line speeds. The following data were collected. Line Number of Speed Defective Parts Found 20 24 20 20 30 20 30 16 40 14 40 16 50 14 50 12{b} what does the scatter diagram developed in part (a) indicate about the relationship between the two variables? 0 There appears to be no noticeable relationship between line speed (feet per minute) and the number of defective parts. 0 There appears to be a positive relationship between line speed (feet per minute) and the number of defective parts. 0 There appears to be a negative relationship between line speed (feet per minute) and the number of defective parts. {:2} Use the least squares method to develop the estimated regression equation. F = :l (d) Predict the number of defective parts found for a line speed of 45 feet per minute. E
Step by Step Solution
There are 3 Steps involved in it

Get step-by-step solutions from verified subject matter experts