

Question: Need some help with the aggregate expenditures & drop-down selections, thanks! The following table shows consumption ((3), investment (I), government spending (G), and net exports

Need some help with the aggregate expenditures & drop-down selections, thanks!


![5?5 250 150 2l]0 : 800 600 250 150 200 S 900](https://s3.amazonaws.com/si.experts.images/answers/2024/06/6669824557bcd_661666982452d74f.jpg)
![625 250 150 2l]0 : The following graph shows real GDP on](https://s3.amazonaws.com/si.experts.images/answers/2024/06/66698245a3f91_661666982458ae78.jpg)
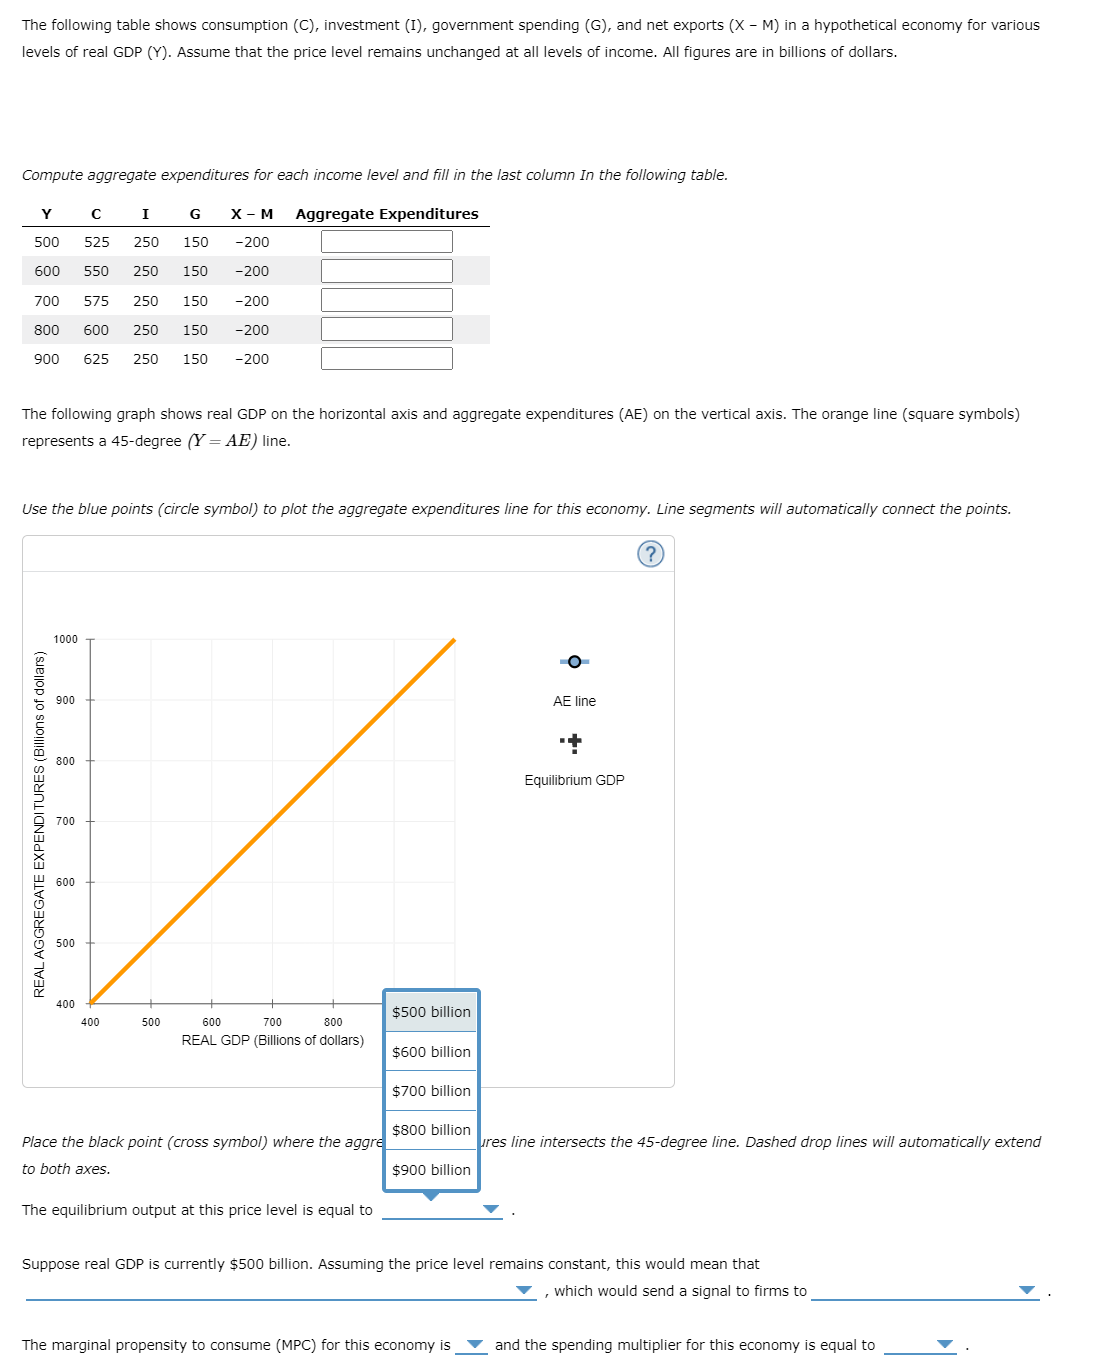
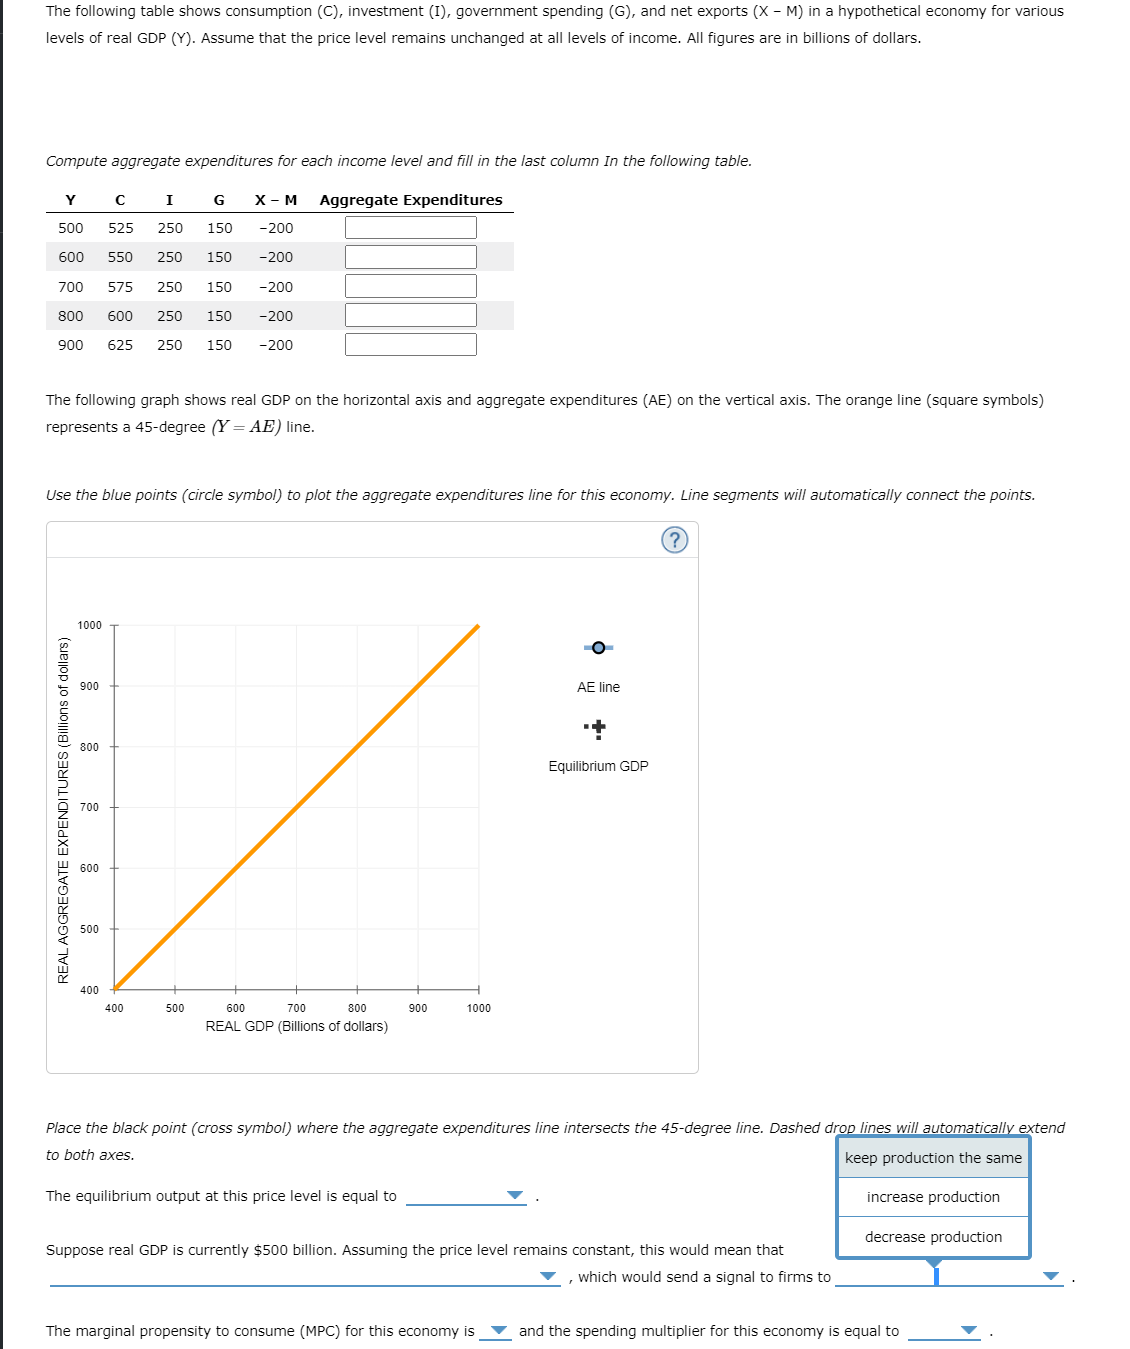
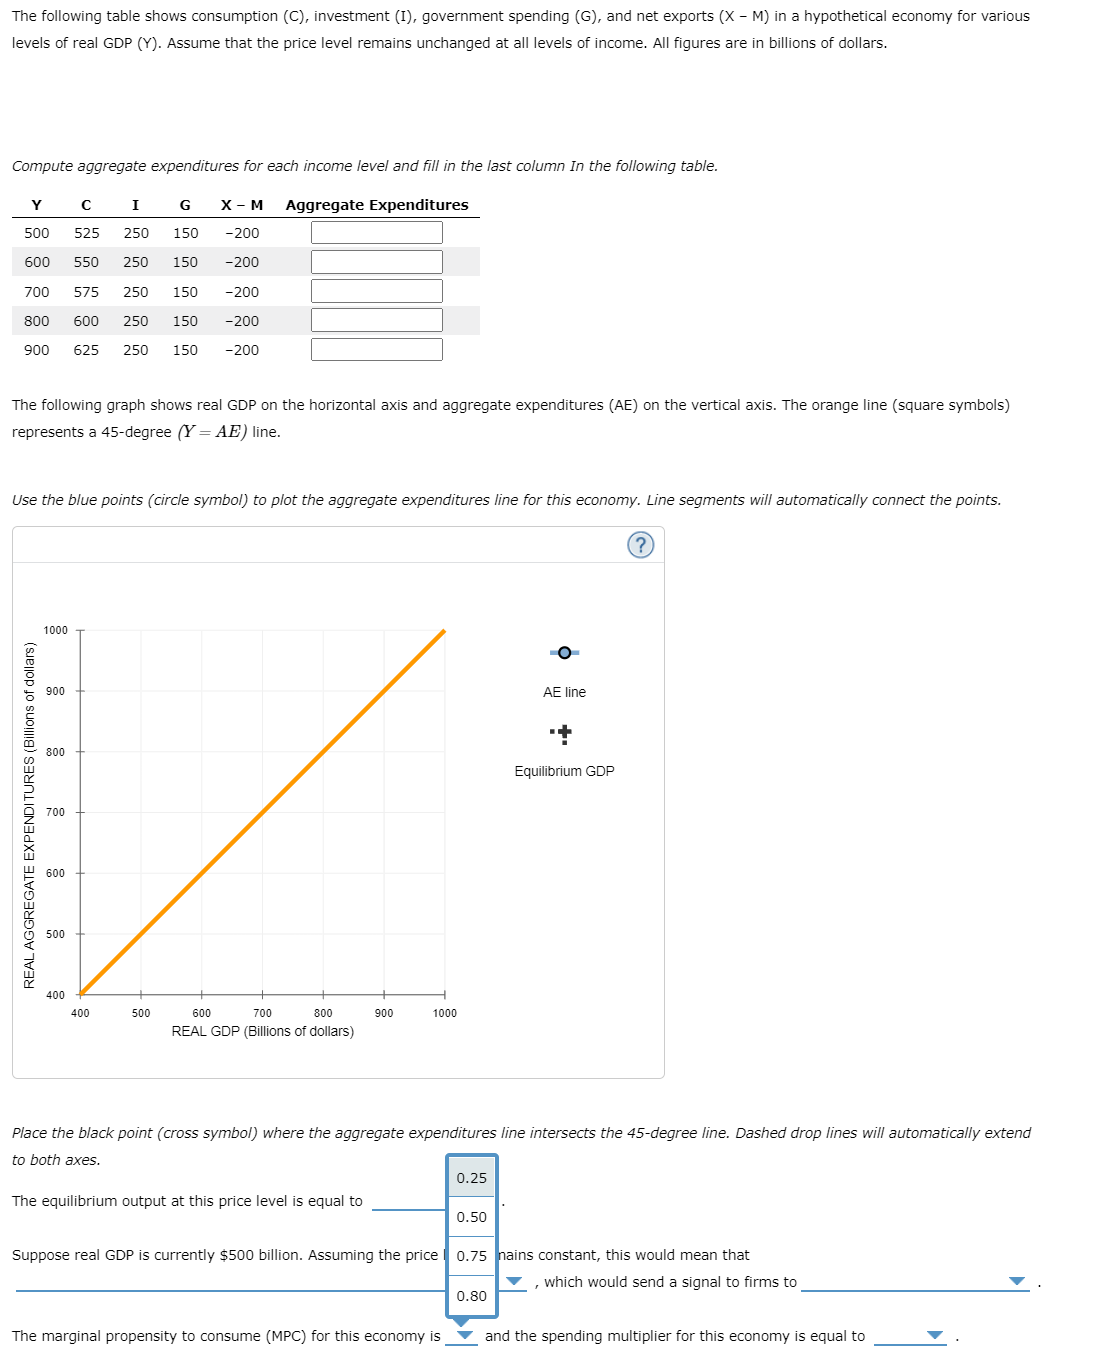
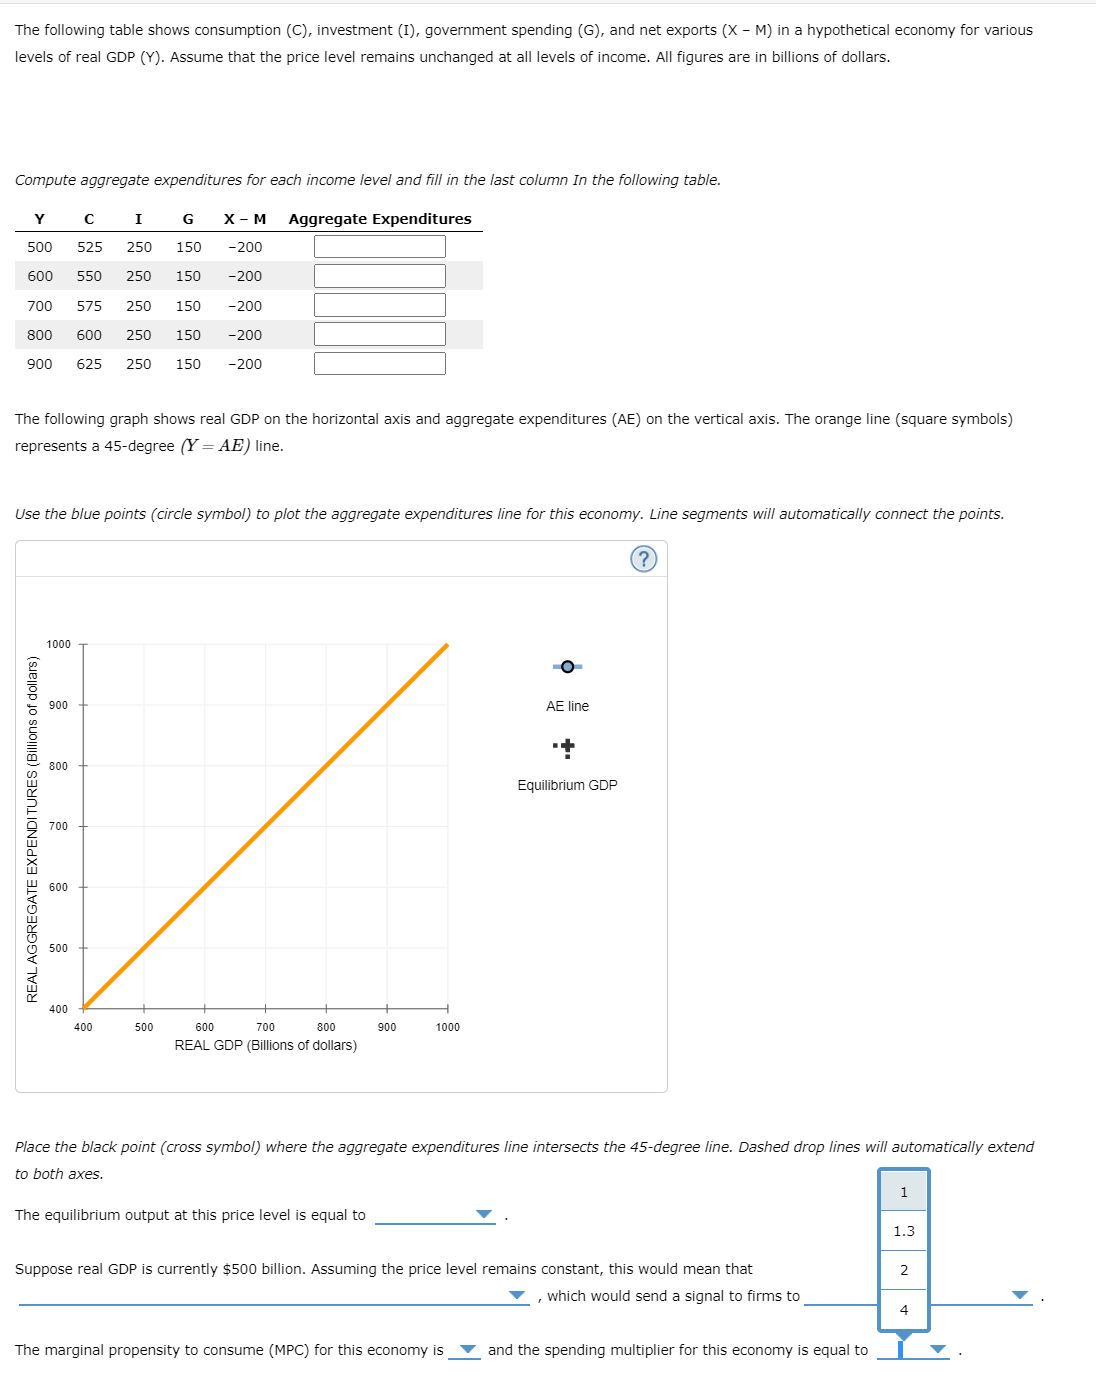
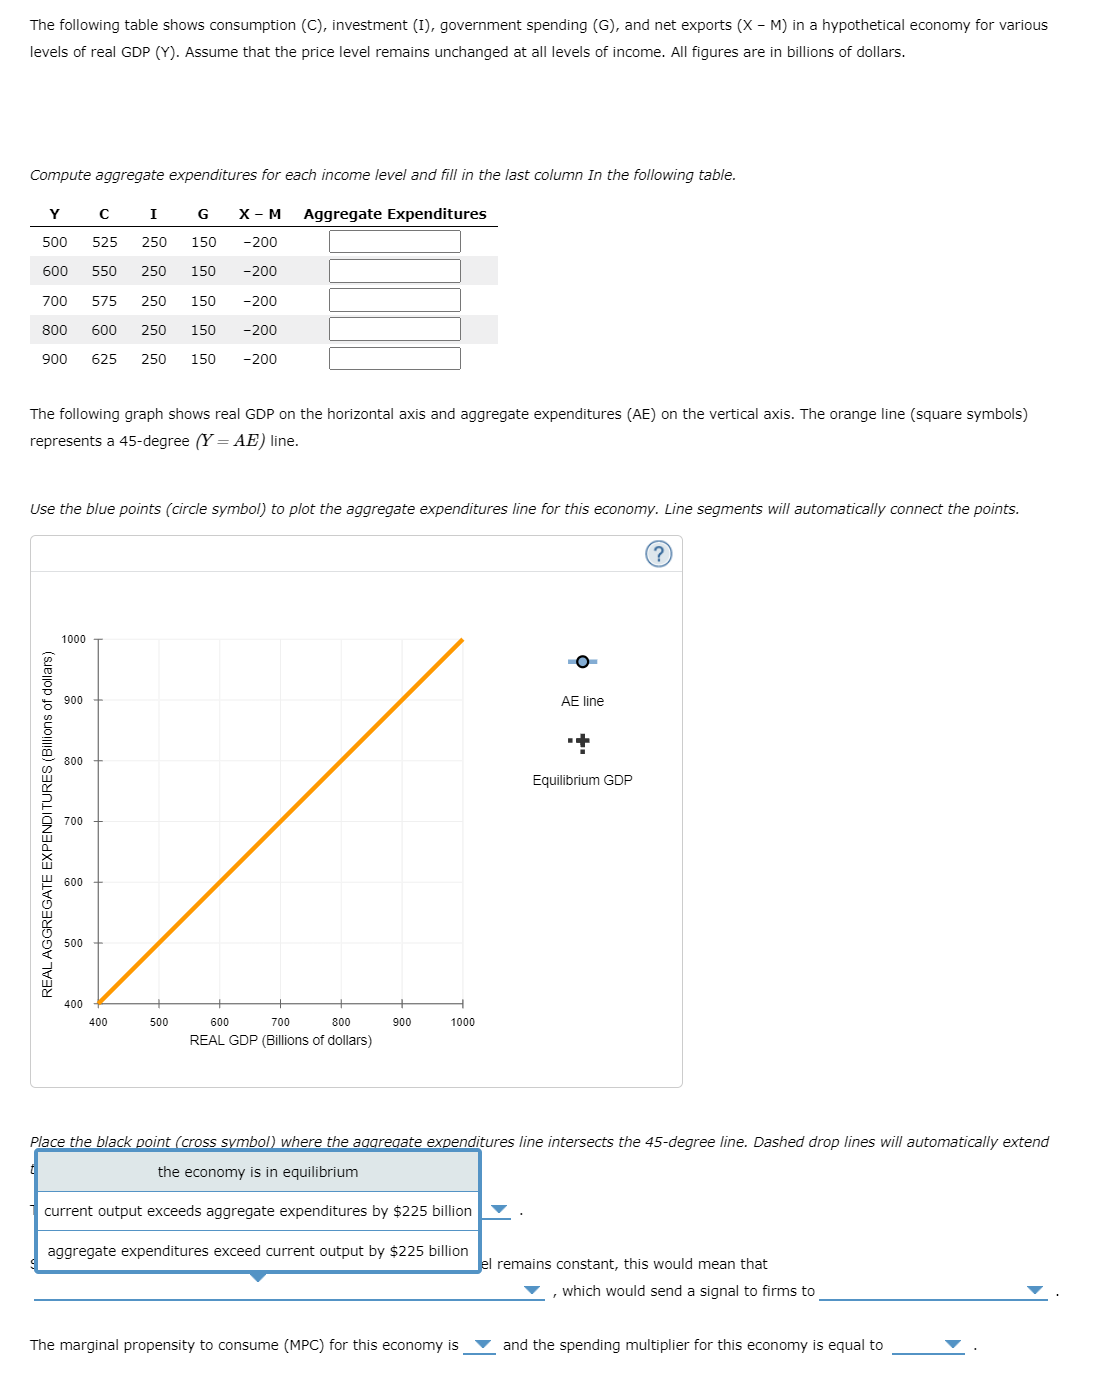
The following table shows consumption ((3), investment (I), government spending (G), and net exports {X M) in a hypothetical economy for various levels of real GDP (Y). Assume that the price level remains unchanged at all levels of income. All gures are in billions of dollars. Compute aggregate expenditures for each income level and ll in the last column In the following table. Y C I G X II-l Aggregate Expenditures 500 525 250 150 200 S 600 550 250 150 200 : mi) 5?5 250 150 2l]0 : 800 600 250 150 200 S 900 625 250 150 2l]0 : The following graph shows real GDP on the horizontal axis and aggregate expenditures (AE) on the vertical axis. The orange line (square symbols) represents a 45degree {Y = A3) line. Use the blue points (circle symbol) to plot the aggregate expenditures line for this economy. tine segments will automatically connect the points. 1000- -- Billions ofdollar's) In 8 '4 300 700 600 500 REAL AGGREGATE EXPENDITURES 400 Place the black point {cross symbol) where the aggr- to both axes. 4:10 50!] l 600 REAL GDP (Billions of dollars) I TIJD l $500 billion son $600 billion $700 billion $800 billion $900 billion The equilibrium output at this price level is equal to C?) -O- AE line '1' Equilibrium GDP res line intersects the 45degree line. Dashed drop lines will automatically extend Suppose real GDP is currently $500 billion. Assuming the price level remains constant, this would mean that V , which would send a signal to rms to V The marginal propensity to consume (MP0) for this economy is V and the spending multiplier for this economy is equal to V . The following table shows consumption (C), investment (1), government spending (G), and net exports (X - M) in a hypothetical economy for various evels of real GDP (Y). Assume that the price level remains unchanged at all levels of income. All figures are in billions of dollars. Compute aggregate expenditures for each income level and fill in the last column In the following table. Y I G X - M Aggregate Expenditures 500 525 250 150 -200 600 550 250 150 -200 700 575 250 150 -200 800 600 250 150 -200 900 625 250 150 -200 The following graph shows real GDP on the horizontal axis and aggregate expenditures (AE) on the vertical axis. The orange line (square symbols) represents a 45-degree (Y = AE) line. Use the blue points (circle symbol) to plot the aggregate expenditures line for this economy. Line segments will automatically connect the points. 1000 O 900 AE line .+ 800 Equilibrium GDP REAL AGGREGATE EXPENDITURES (Billions of dollars) 700 600 500 400 A00 500 600 700 800 900 1000 REAL GDP (Billions of dollars) Place the black point (cross symbol) where the aggregate expenditures line intersects the 45-degree line. Dashed drop lines will automatically extend the economy is in equilibrium current output exceeds aggregate expenditures by $225 billion aggregate expenditures exceed current output by $225 billion Jel remains constant, this would mean that , which would send a signal to firms to The marginal propensity to consume (MPC) for this economy is and the spending multiplier for this economy is equal toThe following table shows consumption (C), investment (1), government spending (G), and net exports (X - M) in a hypothetical economy for various levels of real GDP (Y). Assume that the price level remains unchanged at all levels of income. All figures are in billions of dollars. Compute aggregate expenditures for each income level and fill in the last column In the following table. G X - M Aggregate Expenditures 500 525 250 150 20 600 550 250 150 -200 700 575 250 150 -200 800 600 250 150 -200 900 625 250 150 -200 The following graph shows real GDP on the horizontal axis and aggregate expenditures (AE) on the vertical axis. The orange line (square symbols) represents a 45-degree (Y = AE) line. Use the blue points (circle symbol) to plot the aggregate expenditures line for this economy. Line segments will automatically connect the points. 1000 O 900 AE line 800 Equilibrium GDP REAL AGGREGATE EXPENDITURES (Billions of dollars) 700 600 500 400 400 500 600 700 800 900 1000 REAL GDP (Billions of dollars) Place the black point (cross symbol) where the aggregate expenditures line intersects the 45-degree line. Dashed drop lines will automatically extend to both axes. keep production the same The equilibrium output at this price level is equal to increase production decrease production Suppose real GDP is currently $500 billion. Assuming the price level remains constant, this would mean that , which would send a signal to firms to The marginal propensity to consume (MPC) for this economy is _ and the spending multiplier for this economy is equal toThe following table shows consumption (C), investment (1), government spending (G), and net exports (X - M) in a hypothetical economy for various levels of real GDP (Y). Assume that the price level remains unchanged at all levels of income. All figures are in billions of dollars. Compute aggregate expenditures for each income level and fill in the last column In the following table. G X - M Aggregate Expenditures 500 525 250 150 -200 600 550 250 150 -200 700 575 250 150 -200 800 600 250 150 .200 900 625 250 150 -200 The following graph shows real GDP on the horizontal axis and aggregate expenditures (AE) on the vertical axis. The orange line (square symbols) represents a 45-degree (Y = AE) line. Use the blue points (circle symbol) to plot the aggregate expenditures line for this economy. Line segments will automatically connect the points. ? 1000 O 900 AE line .+ 800 Equilibrium GDP 700 REAL AGGREGATE EXPENDITURES (Billions of dollars) 00 500 400 400 500 600 700 800 900 1000 REAL GDP (Billions of dollars) Place the black point (cross symbol) where the aggregate expenditures line intersects the 45-degree line. Dashed drop lines will automatically extend to both axes. 0.25 The equilibrium output at this price level is equal to 0.50 Suppose real GDP is currently $500 billion. Assuming the price | 0.75 hains constant, this would mean that , which would send a signal to firms to 0.80 The marginal propensity to consume (MPC) for this economy is and the spending multiplier for this economy is equal toThe following table shows consumption (C), investment (1), government spending (G), and net exports (X - M) in a hypothetical economy for various levels of real GDP (Y). Assume that the price level remains unchanged at all levels of income. All figures are in billions of dollars. Compute aggregate expenditures for each income level and fill in the last column In the following table. Y C I G X - M Aggregate Expenditures 500 525 250 150 -200 600 550 250 150 -200 700 575 250 150 -200 800 600 250 150 -200 900 625 250 150 -200 The following graph shows real GDP on the horizontal axis and aggregate expenditures (AE) on the vertical axis. The orange line (square symbols) represents a 45-degree (Y = AE) line. Use the blue points (circle symbol) to plot the aggregate expenditures line for this economy. Line segments will automatically connect the points. 1000 O 900 AE line 800 Equilibrium GDP 700 REAL AGGREGATE EXPENDITURES ( Billions of dollars) 600 500 100 400 500 600 700 800 900 1000 REAL GDP (Billions of dollars) Place the black point (cross symbol) where the aggregate expenditures line intersects the 45-degree line. Dashed drop lines will automatically extend to both axes. 1 The equilibrium output at this price level is equal to 1.3 Suppose real GDP is currently $500 billion. Assuming the price level remains constant, this would mean that , which would send a signal to firms to 4 The marginal propensity to consume (MPC) for this economy is _ and the spending multiplier for this economy is equal to
Step by Step Solution
There are 3 Steps involved in it

Get step-by-step solutions from verified subject matter experts