

Question: need some help with this excel problem?? An investor is considering three mutual funds. The first is a stock fund, the second is a longterm
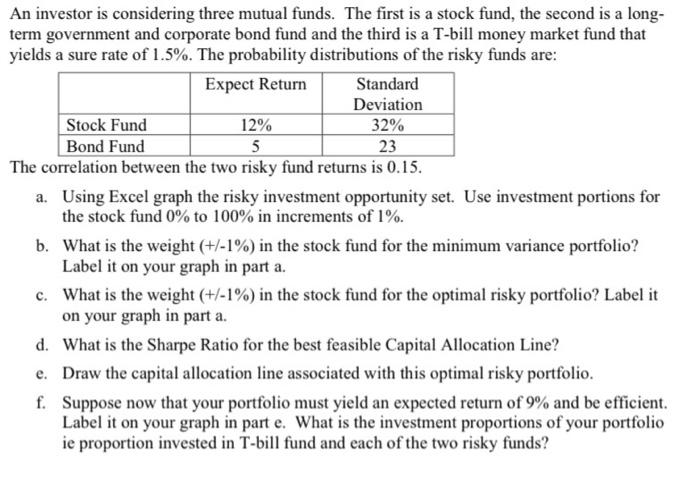
An investor is considering three mutual funds. The first is a stock fund, the second is a longterm government and corporate bond fund and the third is a T-bill money market fund that yields a sure rate of 1.5%. The probability distributions of the risky funds are: The correlation between the two risky fund returns is 0.15. a. Using Excel graph the risky investment opportunity set. Use investment portions for the stock fund 0% to 100% in increments of 1%. b. What is the weight (+/1%) in the stock fund for the minimum variance portfolio? Label it on your graph in part a. c. What is the weight (+/1%) in the stock fund for the optimal risky portfolio? Label it on your graph in part a. d. What is the Sharpe Ratio for the best feasible Capital Allocation Line? e. Draw the capital allocation line associated with this optimal risky portfolio. f. Suppose now that your portfolio must yield an expected return of 9% and be efficient. Label it on your graph in part e. What is the investment proportions of your portfolio ie proportion invested in T-bill fund and each of the two risky funds
Step by Step Solution
There are 3 Steps involved in it

Get step-by-step solutions from verified subject matter experts