

Question: need step by step solution for 9.11 Figure 9.5 Change in Zero-Coupon Yield Curve When One Point Is Shifted Table 9.5 Partial Durations for a
need step by step solution for 9.11
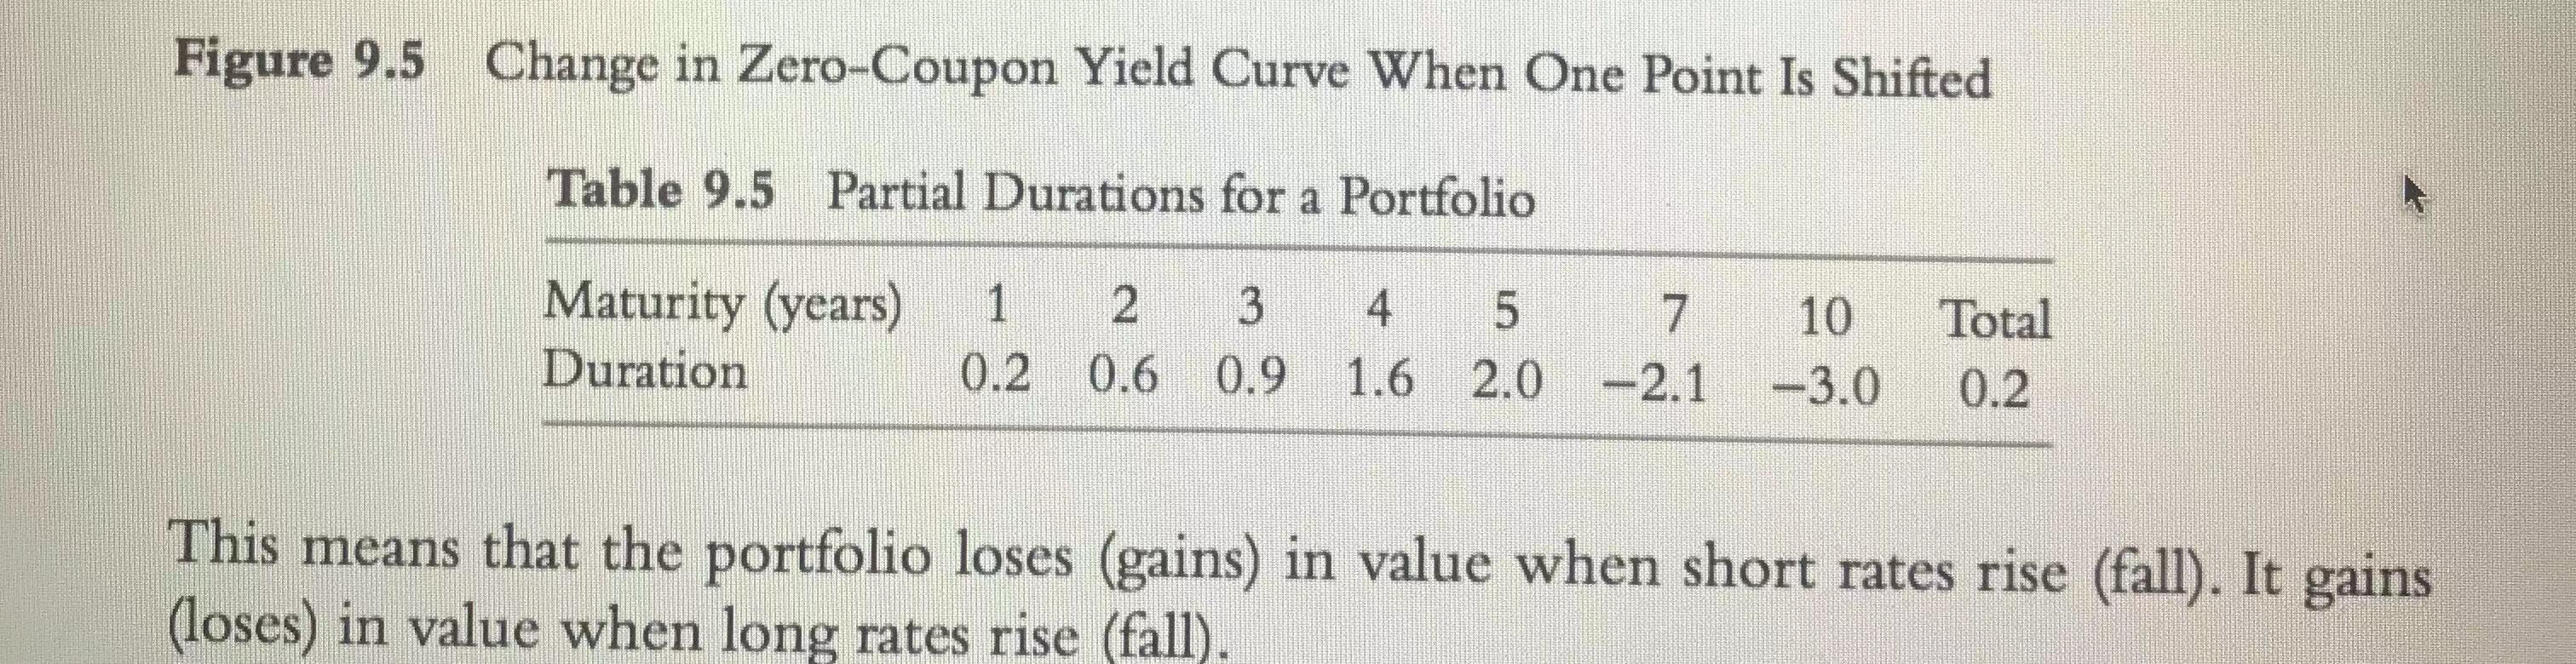
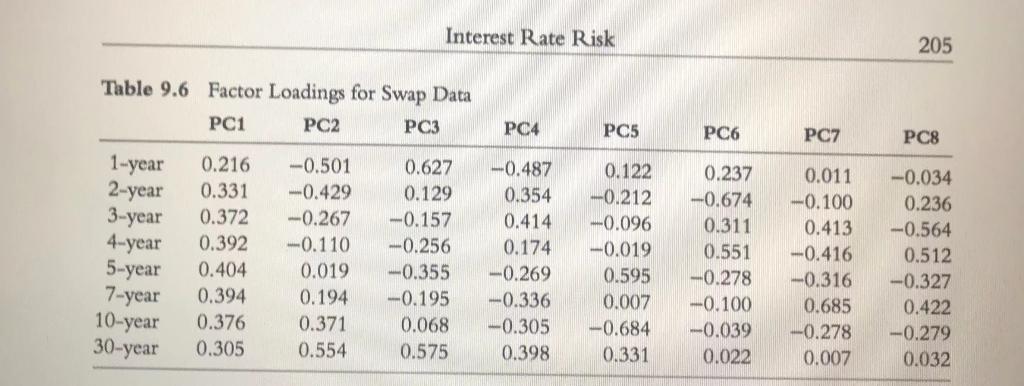
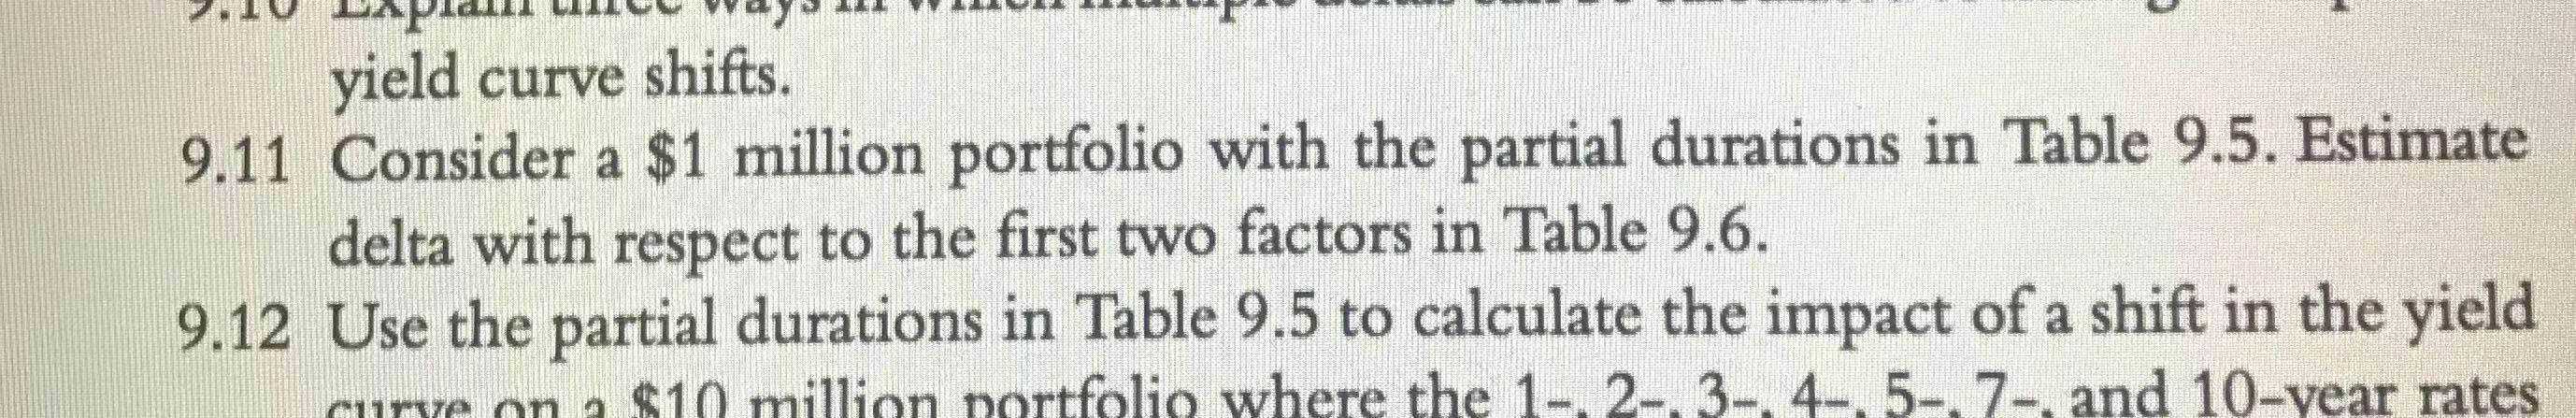
Figure 9.5 Change in Zero-Coupon Yield Curve When One Point Is Shifted Table 9.5 Partial Durations for a Portfolio Maturity (years) Duration 10 1 2 3 0.2 0.6 0.9 4 5 7 1.6 2.0 -2.1 Total 0.2 -3.0 This means that the portfolio loses (gains) in value when short rates rise (fall). It gains (loses) in value when long rates rise (fall). Interest Rate Risk 205 Table 9.6 Factor Loadings for Swap Data PC1 PC2 PC3 PC4 PC5 PC6 POZ PC8 1-year 2-year 3-year 4-year 5-year 7-year 10-year 30-year 0.216 0.331 0.372 0.392 0.404 0.394 0.376 0.305 -0.501 -0.429 -0.267 -0.110 0.019 0.194 0.371 0.554 0.627 0.129 -0.157 -0.256 -0.355 -0.195 0.068 0.575 -0.487 0.354 0.414 0.174 -0.269 -0.336 -0.305 0.398 0.122 -0.212 -0.096 -0.019 0.595 0.007 -0.684 0.331 0.237 -0.674 0.311 0.551 -0.278 --0.100 --0.039 0.022 0.011 -0.100 0.413 -0.416 -0.316 0.685 -0.278 0.007 -0.034 0.236 -0.564 0.512 -0.327 0.422 -0.279 0.032 yield curve shifts. 9.11 Consider a $1 million portfolio with the partial durations in Table 9.5. Estimate delta with respect to the first two factors in Table 9.6. 9.12 Use the partial durations in Table 9.5 to calculate the impact of a shift in the yield curye on a $10 million nortfolio where the 1- 2- 3- 4- 5- 7- and 10-year rates Figure 9.5 Change in Zero-Coupon Yield Curve When One Point Is Shifted Table 9.5 Partial Durations for a Portfolio Maturity (years) Duration 10 1 2 3 0.2 0.6 0.9 4 5 7 1.6 2.0 -2.1 Total 0.2 -3.0 This means that the portfolio loses (gains) in value when short rates rise (fall). It gains (loses) in value when long rates rise (fall). Interest Rate Risk 205 Table 9.6 Factor Loadings for Swap Data PC1 PC2 PC3 PC4 PC5 PC6 POZ PC8 1-year 2-year 3-year 4-year 5-year 7-year 10-year 30-year 0.216 0.331 0.372 0.392 0.404 0.394 0.376 0.305 -0.501 -0.429 -0.267 -0.110 0.019 0.194 0.371 0.554 0.627 0.129 -0.157 -0.256 -0.355 -0.195 0.068 0.575 -0.487 0.354 0.414 0.174 -0.269 -0.336 -0.305 0.398 0.122 -0.212 -0.096 -0.019 0.595 0.007 -0.684 0.331 0.237 -0.674 0.311 0.551 -0.278 --0.100 --0.039 0.022 0.011 -0.100 0.413 -0.416 -0.316 0.685 -0.278 0.007 -0.034 0.236 -0.564 0.512 -0.327 0.422 -0.279 0.032 yield curve shifts. 9.11 Consider a $1 million portfolio with the partial durations in Table 9.5. Estimate delta with respect to the first two factors in Table 9.6. 9.12 Use the partial durations in Table 9.5 to calculate the impact of a shift in the yield curye on a $10 million nortfolio where the 1- 2- 3- 4- 5- 7- and 10-year rates
Step by Step Solution
There are 3 Steps involved in it

Get step-by-step solutions from verified subject matter experts