

Question: Need the answer for question #15 NCOME STATEMENT INFO Sales Cost of Goods Sold $5 728 000 Other Expenses Depreciation Interest Expense Create an income
Need the answer for question #15
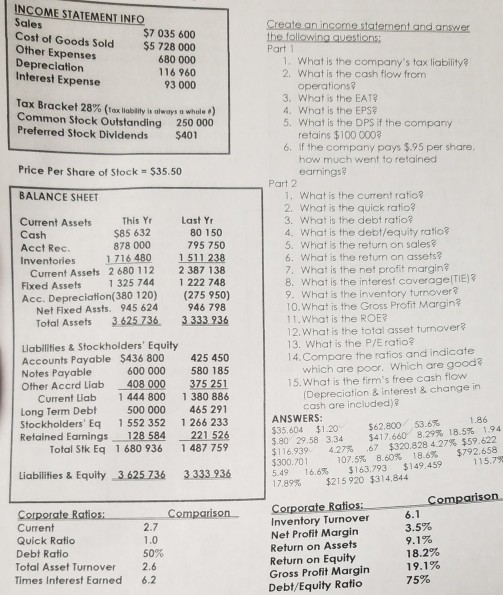
NCOME STATEMENT INFO Sales Cost of Goods Sold $5 728 000 Other Expenses Depreciation Interest Expense Create an income statement and answer th $7 035 600 680 000 116 960 93 000 1, What is the company's tax liability? What is the cash flow from Tax Bracket 28% (axlabaityisolways a whole.) Common Stock Outstanding 250 000 Preferred Stock Dividends $401 operations? 3. What is the EAT? 4. What is the EPS? 5. What is the DPS if the company retains $100 0002 6. If the company pays $.95 per share how much went to retained Price Per Share of Stock $35.50 earnings Part 2 BALANCE SHEET 1. What is the current ratio? 2. What is the quick ratio? 3. What is the debt ratio? 4. What is the debt/equity ratio? 5, what is the return on sales 6. What is the return on assets? 7. What is the net profit margin? This Yr $85 632 878 000 Last Yr Current Assets Cash Acct Rec Inventories 716480 1511238 80 150 795 750 2 680 112 1 325 744 2387 138 1 222 748 Current Assets Fixed Assets hat is the interest coverage TIE) 9. What is the inventory turnover? 10.What is the Gross Profit Margin 11. What is the ROE? 12. What is the total asset turnover? 13. What is the P/E ratio? (275 Acc. Depreciation(380 120) 945 624 946 798 Net Fixed Assts. Total Assets 3 625.736 3333936 Liabilities & Stockholders Equity 425 450 580 185 375 251 1380 886 Long Term Debt 500 000 465 291 Stockholders Eq 1 552 352 1 266 233 Retained Earnings 128 584 221 526 1487 759 Accounts Payable $436 800 4. Compare the ratios and indicate hich are poor. Which are good? Notes Payable Other Accrd Liab 600 000 408 000 1444 800 15. What s the firm's free cash flow Depreciation & interest & change in cash are included)? Current Liab ANSWERS $35.604 $1.20 1.86 $62.800 53.6% '80 29.58 3.34 $4176608.29% 18.5% 1.94 $116.939 4.27% .67 $320.828 4.27% $59,622 $300.701 5.49 16.6% $163,793 $149,459 17.89% $215920 314.844 Total Stk Eq 1680 936 $792.658 8.60% 18.6% 107.5% Liabilities & Equity 3625 736 3333 936 Comparison Comparison Corporate Ratios: Current Quick Ratio Debt Ratio Total Asset Turnover2.6 Times Interest Earned 6.2 Inventory Turnover Net Profit Margin Return on Assets Return on Equity Gross Profit Margin Debt/Equity Ratio 9 18.2% 19 75% 50%
Step by Step Solution
There are 3 Steps involved in it

Get step-by-step solutions from verified subject matter experts