

Question: Need the Market Performance Ratios calculated using the attached information Earnings Per Share = Price Earnings Ratio = The Hobby Horse Company Inc. Income Statement
Need the Market Performance Ratios calculated using the attached information
Earnings Per Share =
Price Earnings Ratio = 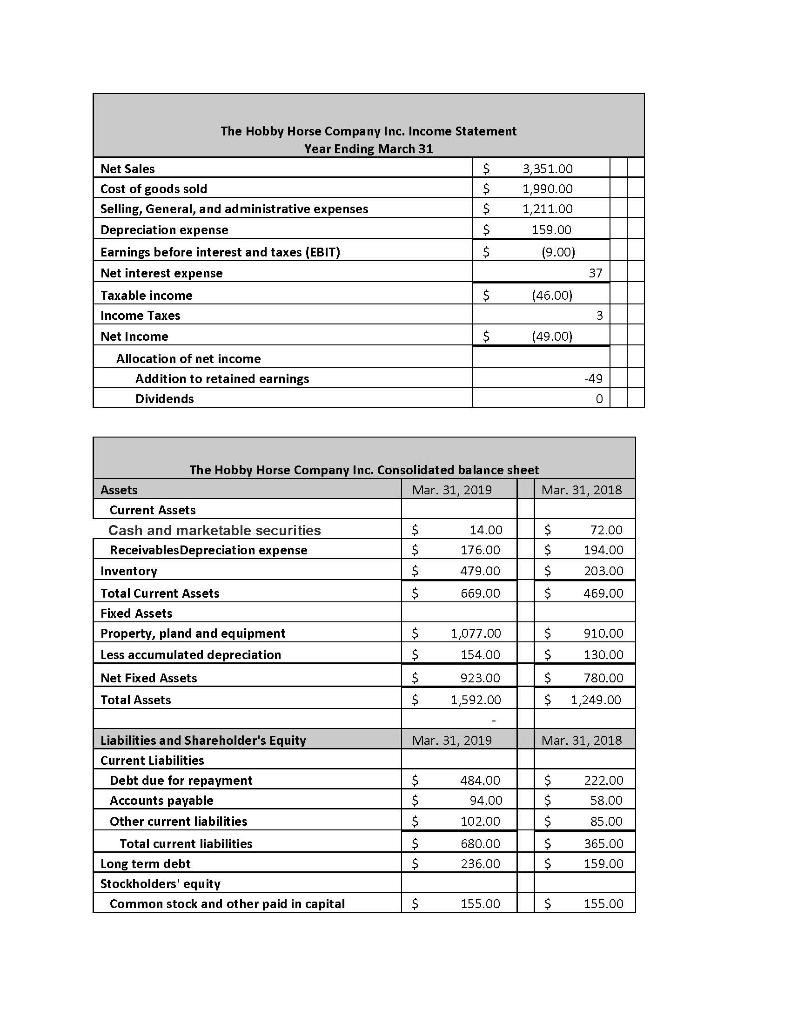
The Hobby Horse Company Inc. Income Statement Year Ending March 31 Net Sales $ 3,351.00 Cost of goods sold $ 1,990.00 Selling, General, and administrative expenses $ 1,211.00 Depreciation expense $ 159.00 Earnings before interest and taxes (EBIT) $ (9.00) Net interest expense Taxable income $ (46.00) Income Taxes Net Income $ (49.00) Allocation of net income Addition to retained earnings Dividends 37 3 -49 0 The Hobby Horse Company Inc. Consolidated balance sheet Assets Mar. 31, 2019 Mar. 31, 2018 Current Assets Cash and marketable securities $ 14.00 $ 72.00 Receivables Depreciation expense $ 176.00 $ 194.00 Inventory $ 479.00 $ 203.00 Total Current Assets $ 669.00 $ 469.00 Fixed Assets Property, pland and equipment $ 1,077.00 $ 910.00 Less accumulated depreciation $ 154.00 $ 130.00 Net Fixed Assets $ 923.00 $ 780.00 Total Assets $ 1,592.00 $ 1,249.00 Mar. 31, 2019 Mar. 31, 2018 484.00 222.00 94.00 Liabilities and Shareholder's Equity Current Liabilities Debt due for repayment Accounts payable Other current liabilities Total current liabilities Long term debt Stockholders' equity Common stock and other paid in capital $ $ $ $ $ $ $ $ $ $ 58.00 85.00 102.00 365.00 680.00 236.00 159.00 $ 155.00 $ 155.00 The Hobby Horse Company Inc. Income Statement Year Ending March 31 Net Sales $ 3,351.00 Cost of goods sold $ 1,990.00 Selling, General, and administrative expenses $ 1,211.00 Depreciation expense $ 159.00 Earnings before interest and taxes (EBIT) $ (9.00) Net interest expense Taxable income $ (46.00) Income Taxes Net Income $ (49.00) Allocation of net income Addition to retained earnings Dividends 37 3 -49 0 The Hobby Horse Company Inc. Consolidated balance sheet Assets Mar. 31, 2019 Mar. 31, 2018 Current Assets Cash and marketable securities $ 14.00 $ 72.00 Receivables Depreciation expense $ 176.00 $ 194.00 Inventory $ 479.00 $ 203.00 Total Current Assets $ 669.00 $ 469.00 Fixed Assets Property, pland and equipment $ 1,077.00 $ 910.00 Less accumulated depreciation $ 154.00 $ 130.00 Net Fixed Assets $ 923.00 $ 780.00 Total Assets $ 1,592.00 $ 1,249.00 Mar. 31, 2019 Mar. 31, 2018 484.00 222.00 94.00 Liabilities and Shareholder's Equity Current Liabilities Debt due for repayment Accounts payable Other current liabilities Total current liabilities Long term debt Stockholders' equity Common stock and other paid in capital $ $ $ $ $ $ $ $ $ $ 58.00 85.00 102.00 365.00 680.00 236.00 159.00 $ 155.00 $ 155.00
Step by Step Solution
There are 3 Steps involved in it

Get step-by-step solutions from verified subject matter experts