

Question: Need the matlab code for this problem Example 5.4 below for part d Note : make your own function on part e PROBLEM 5.12 and
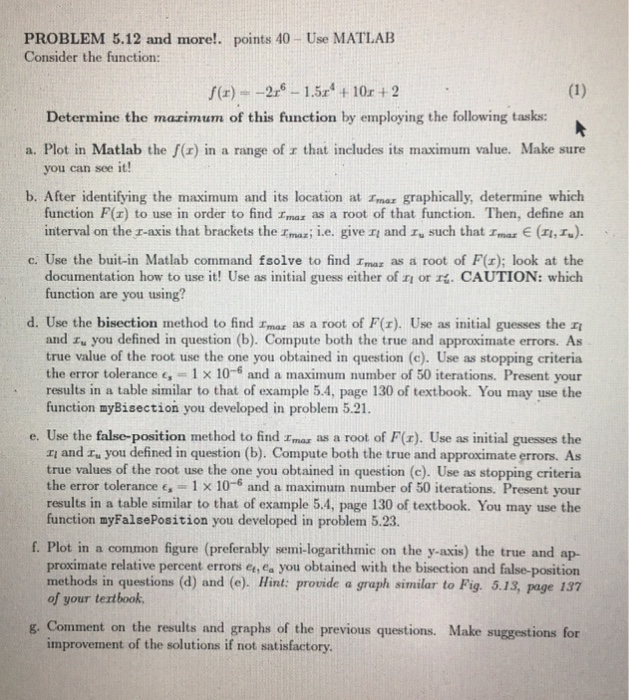
PROBLEM 5.12 and more!. points 40 Use MATLAB Consider the function: f(r)--2re_ 15x4 + 10r t 2 Determine the marimum of this function by employing the following tasks a. Plot in Matlab the f(x) in a range of r that includes its maximum value. Make sure you can see it! b. After identifying the maximum and its location at Imax graphically, determine which function F(r) to use in order to find Imax as a root of that function. Then, define an interval on the r-axis that brackets the maz; i.e. give ri and z, such that Im E (I,). c. Use the buit-in Matlab command fsolve to find Imaz as a root of F(r); look at the CAUTION: which documentation how to use it! Use as initial guess either of 11 or function are you using? d. Use the bisection method to find mas as a root of F(r). Use as initial guesses the r and Fu you defined in question (b). Compute both the true and approximate errors. As true value of the root use the one you obtained in question (c). Use as stopping criteria the error tolerance G = 1 10-6 and a maximum number of 50 iterations. Present your results in a table similar to that of example 5.4, page 130 of textbook. You may use the function myBisection you developed in problem 5.21. e. Use the false-position method to find Imar as a root of F(r). Use as initial guesses the ri and ru you defined in question (b). Compute both the true and approximate errons. As true values of the root use the one you obtained in question (c). Use as stopping criteria the error tolerance es 1 x10⁻⁶ and a maximum number of 50 iterations. Present your results in a table similar to that of example 5.4, page 130 of textbook. You may use the function myFalsePosition you developed in problem 5.23 f. Plot in a common figure (preferably semi-logarithmic on the y-axis) the true and ap- proximate relative percent errors e, ea you obtained with the bisection and false-position methods in questions (d) and (e). Hint: provide a graph similar to Fig. 5.13, page 137 of your tertbook g. Comment on the results and graphs of the previous questions. Make suggestions for improvement of the solutions if not satisfactory PROBLEM 5.12 and more!. points 40 Use MATLAB Consider the function: f(r)--2re_ 15x4 + 10r t 2 Determine the marimum of this function by employing the following tasks a. Plot in Matlab the f(x) in a range of r that includes its maximum value. Make sure you can see it! b. After identifying the maximum and its location at Imax graphically, determine which function F(r) to use in order to find Imax as a root of that function. Then, define an interval on the r-axis that brackets the maz; i.e. give ri and z, such that Im E (I,). c. Use the buit-in Matlab command fsolve to find Imaz as a root of F(r); look at the CAUTION: which documentation how to use it! Use as initial guess either of 11 or function are you using? d. Use the bisection method to find mas as a root of F(r). Use as initial guesses the r and Fu you defined in question (b). Compute both the true and approximate errors. As true value of the root use the one you obtained in question (c). Use as stopping criteria the error tolerance G = 1 10-6 and a maximum number of 50 iterations. Present your results in a table similar to that of example 5.4, page 130 of textbook. You may use the function myBisection you developed in problem 5.21. e. Use the false-position method to find Imar as a root of F(r). Use as initial guesses the ri and ru you defined in question (b). Compute both the true and approximate errons. As true values of the root use the one you obtained in question (c). Use as stopping criteria the error tolerance es 1 x10⁻⁶ and a maximum number of 50 iterations. Present your results in a table similar to that of example 5.4, page 130 of textbook. You may use the function myFalsePosition you developed in problem 5.23 f. Plot in a common figure (preferably semi-logarithmic on the y-axis) the true and ap- proximate relative percent errors e, ea you obtained with the bisection and false-position methods in questions (d) and (e). Hint: provide a graph similar to Fig. 5.13, page 137 of your tertbook g. Comment on the results and graphs of the previous questions. Make suggestions for improvement of the solutions if not satisfactory
Step by Step Solution
There are 3 Steps involved in it

Get step-by-step solutions from verified subject matter experts