

Question: NEED THIS ASAP PLEASE AND THANK YOU IN ADVANCE. HAVE A NICE DAY! The Battle for Value, 2004: FedEx Corp. vs. United Parcel Service, Inc.
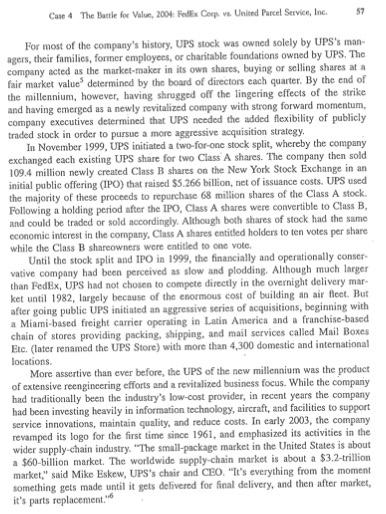
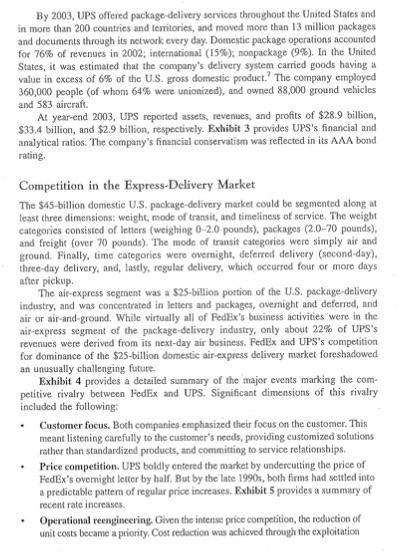
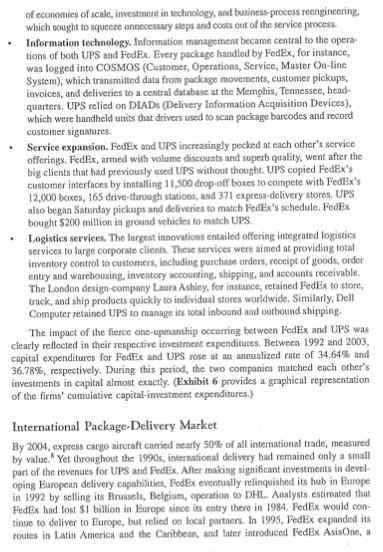
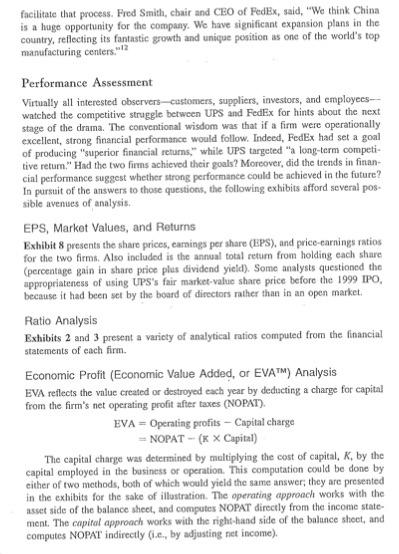
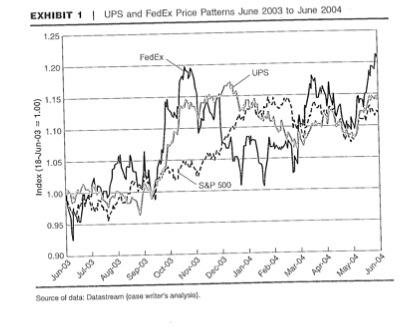
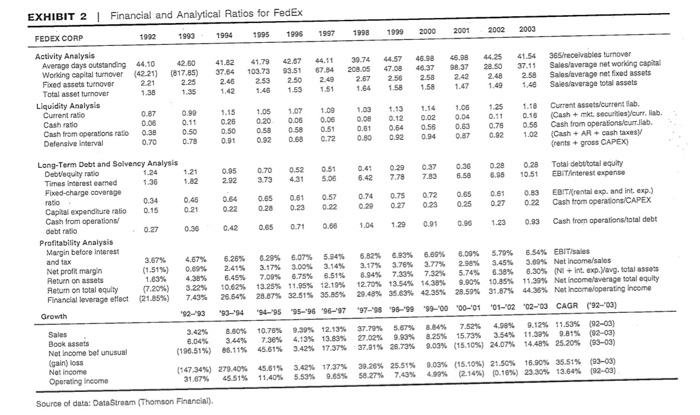
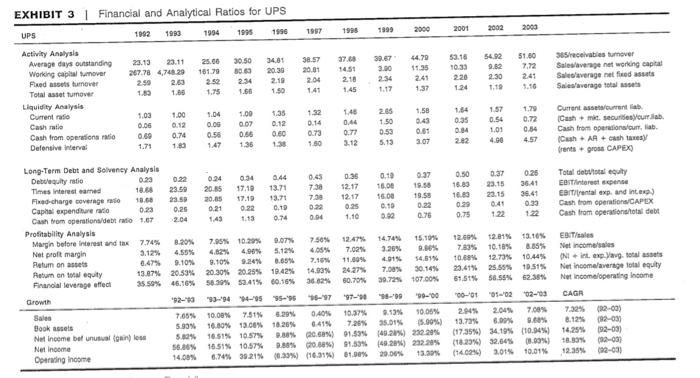
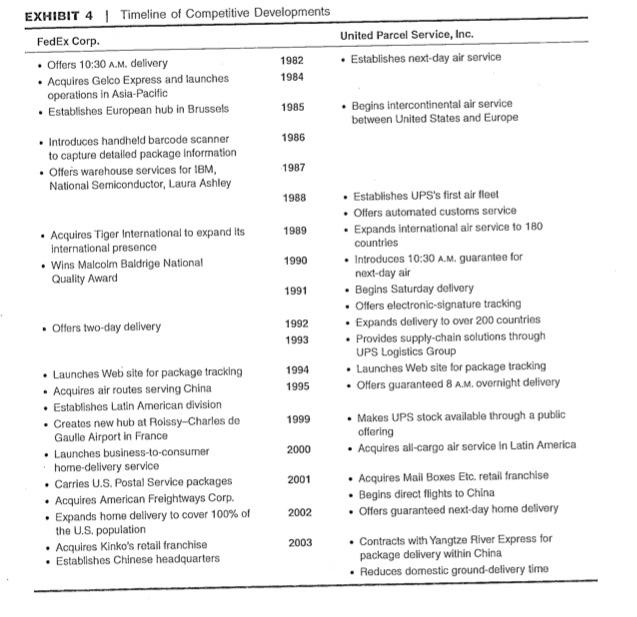
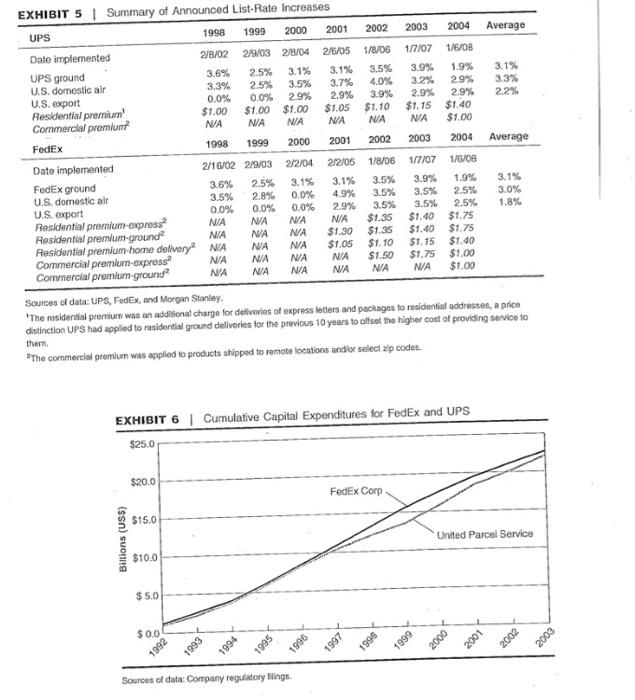
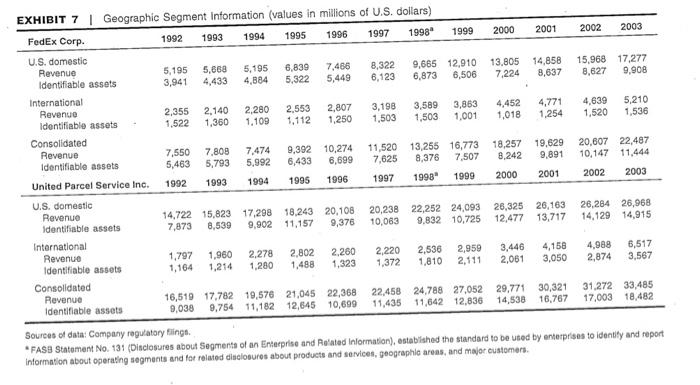
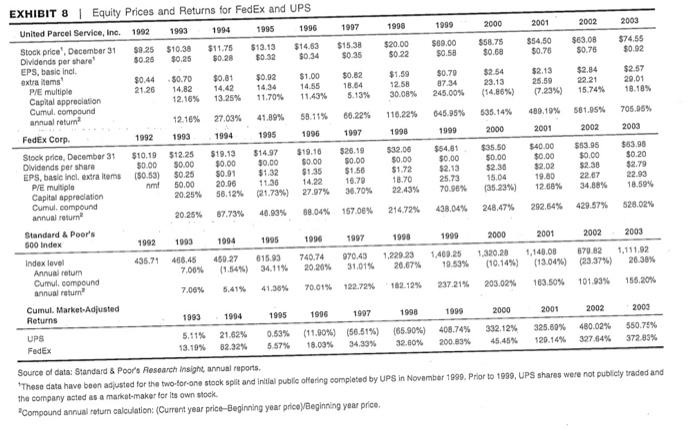
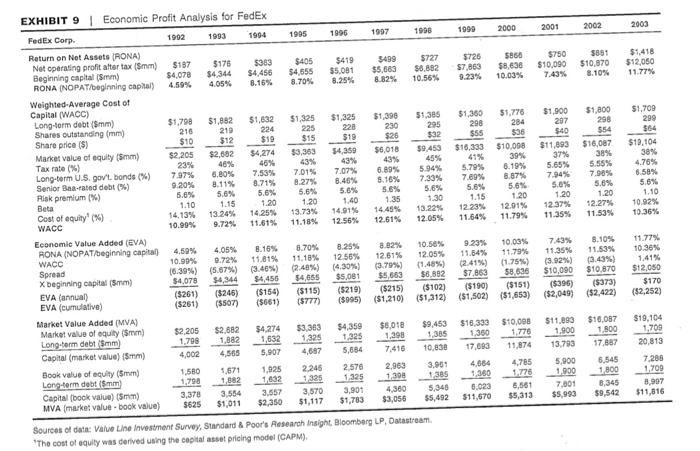
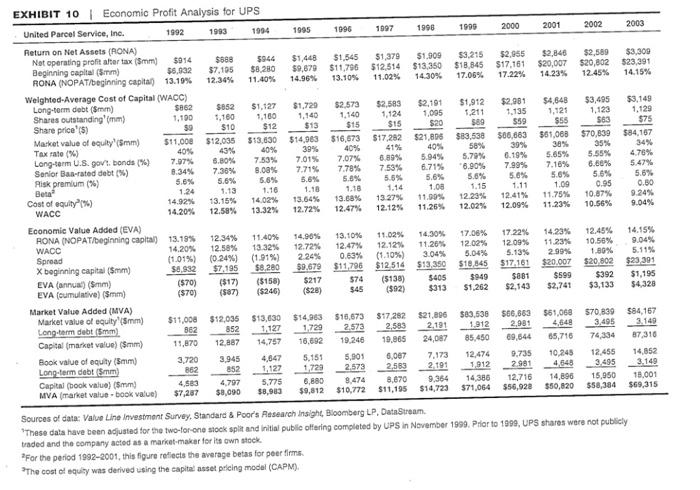
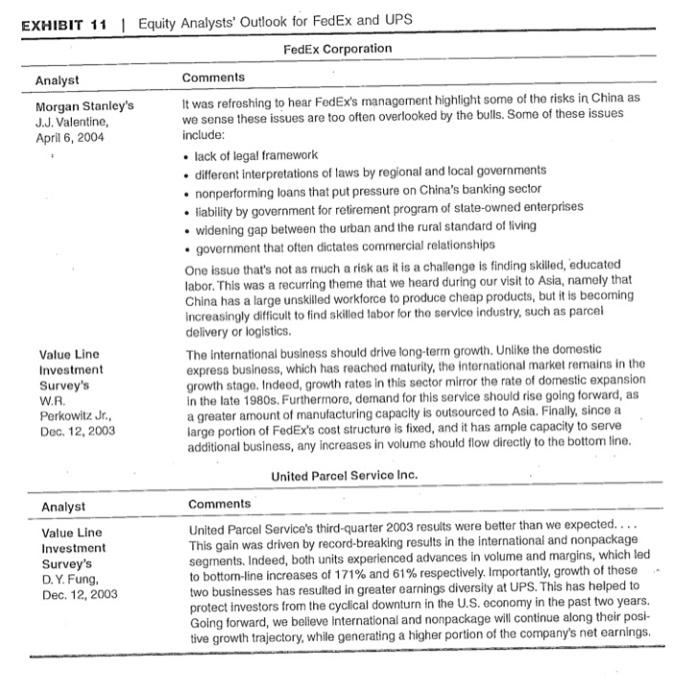
The Battle for Value, 2004: FedEx Corp. vs. United Parcel Service, Inc. FedEx will produce superior financial returns for shareoners by providing high value-added supply chain, transportation, business, and related information services through focused operating companies competing collectively, and managed collaboratively, under the respected FedEx brand. FedEx Mission Statement (Excerpe We serve the evolving distribution, logistics, and commerce needs of our customers worldwide, offering excellence and value in all we do. We sustain financially strong company, with broad employee ownership, that provides a long-term competitive return to our shareowners UPS Mission Statement (Excerpt) On June 18, 2004, the United States and China reached a landmark air-transportation agreement that quintupled the number of commercial cargo flights between the two countries. The agreement also allowed for the establishment of air-cargo hubs in China and landing rights for commercial airlines at any available airport. The pact represented the most dramatic liberalization of air traffic in the history of the two nations, and FedEx Corporation and United Parcel Service, Inc. (UPS), the only U.S. all-cargo carriers then permitted to serve the vast Chinese market,' were certain to be the primary beneficiaries of this opportunity News of the transportation agreement did not come as a major surprise to most observers as U.S. and Chinese negotiators had been in talks since at least February The stock prices of both companies had been rising steadily since those talks began, Northwest Airlines served China through both all cargo and all passenger services. but FedEx's share price had socketed at a rate nearly five times faster than UPS's? Exhibit 1 presents an illustration of recent stock-price patterns for the two firms relative to the S&P 500 Index. FedEx had the largest foreign presence in China, with 11 weekly flights almost twice as many as UPS. The company served 220 Chinese cities, and flew directly to Beijing. Shenzhen, and Shanghai, FedEx's volumes in China had grown by more than 50% between 2003 and 2004. While UPS tagged behind FedEx in the Chinese market, it was still the world's largest package-delivery company and the dominant parcel carrier in the United States. UPS had been active in China since 1988 and was the first carrier in the industry to offer nonstop service from the United States. By 2003, UPS had six weekly Boeing 747 flights to China, with direct flights to Beijing and Shanghai, serving nearly 200 cities. UPS reported a 60% growth in traffic on its principal U.S.-Shanghai route since initiating that service in 2001, and it predicted that peak season demand would exceed its capacity As the U.S. package-delivery segment matured, the international markets--and espe cially China-became a battleground for the two package-delivery giants. PodEx had vir tually invented customer logistical management, and was widely perceived as innovative, entrepreneurial, and an operational leader. Historically, UPS had a reputation for being big, bureaucratic, and an industry follower, but "Big Brown" was aggressively shod- ding its plodding image, as it too became an innovator and a tenacious adversary, UPS had recently undergone a major overhaul of its image, and was repositioning itself as a leading provider of logistics and supply chain management services The 2004 air-transportation agreement between China and the United States was a watershed moment for the international package-delivery business--more than 100 new weekly all-cargo flights were up for grabs with the United States largest trading partner. There was, however, no guarantee for exactly how those new cargo routes would be allocated between UPS and FedEx, companies that had been battling each other for dominance for more than 30 years. Moreover, the eventual assignment to the region of other carriers would test each company's ability to fend off emerging competitive threats. Against this backdrop, industry observers wondered how the titanic struggle between FedEx and UPS would develop. particularly for investors in the two firms. Was the performance of the companies in recent years predictive of the future? Success in China was widely seen as the litmus test for corporate survival in the new millennium. Which company was better positioned to attract the capital necessary to win this competitive battle? FedEx Corporation FedEx first took form as Fred Smith's undergraduate term paper for a Yale University economics class. Smith's strategy dictated that FedEx would purchase the planes that it required to transport packages, whereas all other competitors used the cargo space Between February 18 and June 18, 2008, PodEx's stock price rose 13.9%, whereas UPS's grow 3.1% Fede available on passenger airlines. In addition to using his own planes, Smith's key inno vation was a hub-and-spoke distribution pattern, which permitted cheaper and faster service to more locations than his competitors could offer. In 1971, Smith invested his $4-million inheritance, and raised $91 million in venture capital to launch the fimm--the largest venture capital start-up at the time. In 1973, on the first night of continuous operation, 389 FedEx employees deliv- cred 186 packages overnight to 25 U.S. cities. In those early years FedEx, then known as Federal Express Corporation, experienced severe losses, and Smith was nearly Ousted from his chair position. By 1976. FedEx finally saw a modest profit of $3.6 million on an average daily volume of 19,000 packages. Through the rest of the 1970s, FedEx continued to grow by expanding services, acquiring more trucks and aircraft, and raising capital. The formula was successful. In 1981, FedEx generated more revenue than any other U.S. air-delivery company By 1981, competition in the industry had started to rise. Emery Air Freight began to imitate FedEx's hub system and to acquire airplanes, and UPS began to move into the overnight air market. The United States Postal Service (USPS) positioned its overnight letter at half the price of FedEx's, but quality problems and FedEx's "absolutely positively overight" ad campaign quelled that potential threat. In 1983, FedEx reached $1 billion in revenues and seemed poised to own the market for express delivery During the 1990s, FedEx proved itself as an operational leader, even receiving the prestigious Malcolm Baldrige National Quality Award from the President of the United States. FedEx was the first company ever to win in the service category. Part of this success could be attributed to deregulation and to operational strategy, but credit could also be given to FedEx's philosophy of "People-Service-Profit." which reflected its emphasis on customer focus, total quality management, and employee participation. Extensive attitude surveying, a promote-from-within policy, effective grievance procedures that sometimes resulted in a chat with Fred Smith himself, and an emphasis on personal responsibility and initiative not only earned FedEx a reputation as a great place to work, but also helped to keep the firm largely free of unions. FedEx's growth occurred within the context of fundamental change in the busi- ness environment. Deregulation of the domestic airline industry permitted larger plants to replace smaller ones, thereby permitting FedEx to purchase several Boeing 727s, which helped reduce its unit costs. Trucking industry deregulation also permitted FedEx to establish an integrated regional tracking system that lowered its unit costs on short-haul trips, enabling the company to compete more effectively with UPS Rising inflation and global competitiveness compelled manufacturers to manage inventories more closely and to emulate the just-in-time (JIT) supply programs of the Japanese, creating a heightened demand for PodEx's rapid and carefully moni tored movement of packages. And, finally, technological innovations enabled FedEx to achieve important advances in customer ordering, package tracking, and process monitoring By the end of 2003, FedEx had nearly $15.4 billion in assets and not income of $830 million on revenues of about $22.5 billion. Exhibit 2 provides FedEx's 56 Part One Setting Some Themes financial and analytical ratios. The company had about 50,000 ground vehicles, 625 er- craft, 216,500 full- and part-time employees, and shipped more than 5.4 million pack- ages daily. United Parcel Service, Inc. Founded in 1907. United Parcel Service, Inc., was the largest package-delivery com- pany in the world. Consolidated parcel delivery, both on the ground and through the air, was the primary business of the company, although increasingly the company offered more specialized transportation and logistics services. Known in the industry as Big Brown, UPS had its roots in Seattle, Washington, where 19-year-old Jim Casey started a bicycle-messenger service called American Messenger Company. After merging with a rival firm, Motorcycle Delivery Company, the company focused on department store deliveries, and that remained true until the 1940s. Rentmed United Parcel Service of America, UPS started an air-delivery serv- ice in 1929 by putting packages on commercial passenger planes. The company entered its strongest period of growth during the post-World War II cconomic boom and, by 1975, UPS had reached a milestone when it could promise package delivery to every address in the continental United States. That same year the company expanded outside the country with its first delivery to Ontario, Canada. The following year, UPS began service in West Germany with 120 of its trademark brown delivery vans. The key to the success of UPS, later headquartered in Atlanta, Georgia, was eff- ciency. According to Business Week, "Every route is timed down to the traffic light. Each vehicle was engineered to exacting specifications. And the drivers... endure a daily routine calibrated down to the minute. But this demand for machinelike pre- cision met with resistance by UPS's heavily unionized labor force. Of those demands, UPS driver Mark Dray said: ... drivers are expected to keep procise schedules (with hours broken down into hundredths) that do not allow for variables such as weather, traffic conditions, and package volume. If they're behind they're reprimanded, and if they're ahead of schedule, their soutes are lengthened. In its quest for efficiency, UPS experienced several major strikes resulting from changes in labor practices and driver requirements. In August 1997, the 190,000 team- sters employed at UPS went on strike for 15 days before agreeing to a new five-year contract. In addition to large wage increases, the new agreement called for the cre- ation of 10,000 new full-time jobs and the shifting of 10,000 part-time workers into full-time positions. The strike cost UPS S700 million in lost revenue, resulting in less than 1% sales growth for the year (1996) and a decline in profits to $909 million from $1.15 billion 57 Cure The Battle for Volur, 2004: Pedia Corp ve Unlod Parcel Service, Inc. For most of the company's history, UPS stock was owned solely by UPS's man agers, their familios, forner employees, or charitable foundations owned by UPS. The company acted as the market-maker in its own shares, buying or selling shares at a fair market value determined by the board of directors each quarter. By the end of the millennium, however, having shrugged off the lingering effects of the strike and having emerged as a newly revitalized company with strong forward momentum, company executives determined that UPS needed the added flexibility of publicly traded stock in order to pursue a more aggressive acquisition strategy, In November 1999, UPS initiated a two-for-one stock split, whereby the company exchanged cach existing UPS share for two Class A shares. The company then sold 109.4 million newly created Class B shares on the New York Stock Exchange in an initial public offering (IPO) that raised $5.266 billion, net of issuance costs. UPS used the majority of these proceeds to repurchase 68 million shares of the Class A stock. Following a holding period after the IPO, Class A shares were convertible to Class B, and could be traded or sold accordingly. Although both shares of stock had the same economic interest in the company. Class A shares entitled holders to ten votes per share while the Class B shareowners were entitled to one vote Until the stock split and IPO in 1999, the financially and operationally conser vative company had been perceived as slow and plodding. Although much larger than FedEx, UPS hnd not chosen to compete directly in the overnight delivery mar ket until 1982, largely because of the enormous cost of building an air fleet. But after going public UPS initiated an aggressive series of acquisitions, beginning with a Miami-based freight carrier operating in Latin America and a franchise-based chain of stores providing packing, shipping, and mail services called Mail Boxes Etc. (later renamed the UPS Store) with more than 4,300 domestic and international locations More assertive than ever before, the UPS of the new millennium was the product of extensive reengineering efforts and a revitalized business focus. While the company had traditionally been the industry's low-cost provider, in recent years the company had been investing heavily in information technology, aircraft, and facilities to support service innovations, maintain quality, and reduce costs. In early 2003, the company revamped its logo for the first time since 1961, and emphasized its activities in the wider supply-chain industry. "The small-package market in the United States is about a $60 billion market. The worldwide supply chain market is about a $3.2-trillion market," said Mike Eskew, UPS's chair and CEO. "It's everything from the moment something gets made until it gets delivered for final delivery, and then after market, it's parts replacement." By 2003, UPS offered package-delivery services throughout the United States and in more than 200 countries and territories, and moved more than 13 million packages and documents through its network every day. Domestic package operations accounted for 76% of revenues in 2002, international (15%); nonpackage (9%). In the United States, it was estimated that the company's delivery system carried goods having a value in excess of 6% of the U.S. gross domestic product. The company employed 360,000 people (of whom 64% were unionized), and owned 88,000 ground vehicles and 583 aircraft. At year-end 2003, UPS reported assets, revenues, and profits of $28.9 billion, $33.4 billion, and $2.9 billion, respectively. Exhibit 3 provides UPS's financial and analytical ratios. The company's financial conservatism was reflected in its AAA bond rating Competition in the Express-Delivery Market The $45-billion domestic U.S. package-delivery market could be segmented along at least three dimensions: weight, mode of transit, and timeliness of service. The weight categories consisted of letters (weighing 0-2.0 pounds), packages (2,0-70 pounds). and freight (over 70 pounds). The mode of transit categories were simply air and ground. Finally, time categories were overnight, deferred delivery second day). three-day delivery, and, lastly, regular delivery, which occurred four or more days after pickup The air-express segment was a $25-billion portion of the U.S. package-delivery industry, and was concentrated in letters and packages, overnight and deferred, and air or air and ground. While virtually all of FedEx's business activities were in the air-express segment of the package-delivery industry, only about 22% of UPS's revenues were derived from its next-day air business. FedEx and UPS's competition for dominance of the $25-billion domestic air-express delivery market foreshadowed an unusually challenging future. Exhibit 4 provides a detailed summary of the major events marking the com- petitive rivalry between FedEx and UPS. Significant dimensions of this rivalry included the following: Customer focus. Both companies emphasized their focus on the customer. This meant listening carefully to the customer's needs, providing customized solutions rather than standardized products, and committing to service relationships. Price competition. UPS boldly entered the market by undercutting the price of FedEx's overnight letter by half. But by the late 1990s, both firms had settled into a predictable pattern of regular price increases. Exhibit 5 provides a summary of recent rate increases Operational reengineering. Given the intense price competition, the reduction of unit costs became a priority, Cost reduction was achieved through the exploitation of economies of scale, investment in technology, and business process reengineering, which sought to squeeze unnecessary steps and costs out of the service process Information technology. Information management became central to the opera tions of both UPS and FedEx. Every package handled by FedEx, for instance, was logged into COSMOS (Customer, Operations, Service, Master On-line System), which transmitted data from package movements, customer pickups, invoices, and deliveries to a central database at the Memphis, Tennessee, head- quarters, UPS relied on DIADs Delivery Information Acquisition Devices), which were handheld units that drivers used to scan package barcodes and record customer signatures. Service expansion. FedEx and UPS increasingly pecked at each other's service offerings. FedExarmed with volume discounts and superb quality, went after the big clients that had previously used UPS without thought UPS copied FedEx's customer interfaces by installing 11,500 drop-off boxes to compete with FedEx's 12,000 boxes, 165 drive-through stations, and 371 express-delivery stores. UPS also began Saturday pickups and deliveries to match FedEx's schedule. FedEx bought $200 million in ground vehicles to match UPS. Logistics services. The largest innovations entailed offering integrated logistics services to large corporate clients. These services were aimed at providing total inventory control to customers, including purchase orders, receipt of goods, order entry and warchousing, inventory accounting, shipping, and accounts receivable. The London design-company Laura Ashley, for instance, retained vedlix to store, track, and ship products quickly to individual stores worldwide. Similarly, Dell Computer retained UPS to manage its total inbound and outbound shipping, The impact of the fierce one-uperianship occurring between FedEx and UPS was clearly reflected in their respective investment expenditures. Between 1992 and 2003, capital expenditures for FedEx and UPS rose at an annualized rate of 34.64% and 36.78%, respectively. During this period, the two companies matched each other's investments in capital almost exactly. (Exhibit 6 provides a graphical representation of the firms' cumulative capital-investment expenditures.) International Package-Delivery Market By 2004, express cargo aircraft carried nearly 50% of all international trade, measured by value." Yet throughout the 1990s, international delivery had remained only a small part of the revenues for UPS and FedEx. After making significant investments in devel- oping European delivery capabilities, FedEx eventually relinquished its hub in Europe in 1992 by selling its Brussels, Belgium, operation to DHL Analysts estimated that FedEx had lost $1 billion in Furope since its entry there in 1984. FedEx would con- tinue to deliver to Europe, but relied on local partners. In 1995, FedEx expanded its routes in Latin America and the Caribbean, and later introduced FedEx AsiaOne, a next-business day service between Asian countries and the United States via a hub in Subic Bay, Philippines UPS did not break into the European market in carnest until 1988, with the acqui. sition of 10 European courier services. To enhance its international delivery systems, UPS created a system that coded and tracked packages and automatically billed customers for customs duties and taxes. UPS hoped that its international service would account for one-third of total revenue by 2000. In May 1995, it announced that it would spend more than $1 billion to expand its European operations during the next five years. Exhibit 7 presents international and domestic (U.S.) segment data for FedEx and UPS. According to economic and industry experts, China would become the world's second-largest economy within 11 years and the largest by 2039. It was already the world's largest market for mobile phones and a key center for the production of textiles, computer chips, and other high-tech products. According to recent economic projections, inter Asia trade was projected to grow at a rate of 16.8% annually through 2005. The overall market for air cargo in China had been growing at 30% a year and was expected to increase at nearly that pace for the next five years, FedEx and UPS focused primarily on the import/export package market and not the intra-China domestic market, using local partners to pick up and deliver parcels within the country (although, by December 2005, cach company would be permitted to own completely package operations in China). One industry source believed the domestic parcel market was approximately $800 million, while China's export-import market was nearly $1 billion. "As it becomes the workshop of the world," one observer noted, "leeming factories along the Pearl and Yangtze river deltas represent both the start of the world's supply chain and the source of some of its biggest transport bottlenecks..!! The newly announced U.S.-China air-service agreement would allow an additional 195 weekly flights for each country-111 by all-cargo carriers and 84 by passenger airlines-resulting in a total of 249 weekly fights by the end of a six-year phase-in period. The two countries also agreed to allow their carriers to serve any city in the other country. Until that time, Chinese carriers were limited to twelve U.S. cities, and U.S. pas- senger carriers could fly to only five Chinese cities. The agreement also provided that when carriers established cargo hubs in the other country, they would be granted a high degree of operating flexibility. According to U.S. Transportation Secretary Norman Mincta, "This agreement represents a giant step forward in creating an international air-transportation system that meets the needs of the new global marketplace." UPS and FedEx both welcomed the news. "This provides an extraordinary oppor- tunity for strengthening commercial supply chains that support growing international trade between the United States and China and throughout the world," said Mike Eskew, UPS chair and CEO, who added that the hub provision in the agreement would facilitate that process. Fred Smith, chair and CEO of FedEx, said, "We think China is a huge opportunity for the company. We have significant expansion plans in the country, reflecting its fantastic growth and unique position as one of the world's top manufacturing centers. 12 Performance Assessment Virtually all interested observers-customers, suppliers, investors, and employees-- watched the competitive struggle between UPS and FedEx for hints about the next stage of the drama. The conventional wisdom was that if a firm were operationally excellent, strong financial performance would follow. Indeed, FedEx had set a goal of producing "superior financial retums," while UPS targeted" long-term competi- tive return." Had the two finns achieved their goals? Moreover, did the trends in finan- cial performance suggest whether strong performance could be achieved in the future? In pursuit of the answers to those questions, the following exhibits afford several pos- sible avenues of analysis EPS, Market Values, and Returns Exhibit 8 presents the share prices, camnings per share (EPS), and price-carnings ratios for the two firms. Also included is the annual total retum from holding cach share (percentage gain in share price plus dividend yield). Some analysts questioned the appropriateness of using UPS's fair market value share price before the 1999 IPO, because it had been set by the board of directors rather than in an open market. Ratio Analysis Exhibits 2 and 3 present a variety of analytical ratios computed from the financial statements of each firm. Economic Profit (Economic Value Added, or EVAT) Analysis EVA reflects the value created or destroyed each year by deducting a charge for capital from the firm's net operating profit after taxes (NOPAT) EVA - Operating profits - Capital charge = NOPAT - (K x Capital) The capital charge was determined by multiplying the cost of capital, K, by the capital employed in the business or operation. This computation could be done by cither of two methods, both of which would yield the same answer, they are presented in the exhibits for the sake of illustration. The operating approach works with the asset side of the balance sheet, and computes NOPAT directly from the income state- ment. The capital approach works with the right-hand side of the balance sheet, and computes NOPAT" indirectly (.., by adjusting net income) Estimating Capital Exhibits 9 and 10 calculate the actual amount of capital from both an operating and a capital approach. Included in capital are near-capital items that represent economic value employed on behalf of the firm, such as the present value of operating leases, amortized goodwill and losses. The rationale for including losses and write-offs in continuing capital is that such losses represent unproductive assets or a failed investment. Were they excluded from the capital equation, the sum would only count successful efforts and would not accurately reflect the performance of the firm, Estimating NOPAT Exhibits 9 and 10 calculate NOPAT with a similar regard for losses and write-offs. Here, the aim is to arrive at the actual cash generated by the concern. To do so, the exhibits add increases in deferred taxes back into income because it is not a cash expense, and calculate the interest expense of the leased oper ating assets as if they were leased capital assets. Estimating Cost of Capital The capital charge applied against NOPAT should be based on a blend of the costs of all the types of capital the firm employs, or the weighted average cost of capital (WACC). The cost of debt (used for both debt and lenses) is the annual rate consistent with each firm's bond rating (BBB for FedEx and AAA for UPS). The cost of equity may be estimated in a variety of ways. In the analysis here, the capital asset pricing model (CAPM) was employed. FedEx's beta and cost of equity are used in estimating FedEx's cost of capital. Because UPS beta was unobservable, the analysis that follows uses the average annual betas for UPS's publicly held peer firms: FedEx, Air Express, Airborne Freight, Roadway, Yellow Transport, and J.B. Hunt Transport Estimating EVA and MVA In Exhibits 9 and 10, the stock of capital and the flow of cash are used to calculate the actual return and, with the introduction of the WACC, to calculate the EVA. These exhibits present the EVA calculated each year and cumu- latively over time. The panel at the bottom of each exhibit estimates the market value created or destroyed (or the market value added [MVA]) over the observation period. MVA is calculated as the difference between the current market value of the company and its investment base. The market value created could be compared with cumula- tive EVA. In theory, the following relationships would hold: MVA - Present value of all future EVA MVA - Market value of debt and equity - Capital Thus, Market value Capital + Present value of all future EVA In other words, maximizing the present value of EVA would amount to maxi- mizing the market value of the firm. Outlook for FedEx and UPS About 70% of FedEx's common shares were held by institutional investors that, it could be assumed, were instrumental in setting the prices for the company's shares Typically, those investors absorbed the thinking of the several securities analysts who followed FedEx and UPS in 2004. Exhibit 11 contains excerpts from various equity reports, which indicate the outlook held by those analysts. Observers of the air-express package-delivery industry pondered the recent per formance of the two leading firms and their prospects. What had been the impact of the intense competition between the two firms? Which firm was doing better? The companies faced a watershed moment with the dramatic liberalization of the oppor tunities in China. Might their past performance contain clues about the prospects for future competition? Index (18-Jun-03 1.00) 09 0.95 1.00 1.05 1.10 1.15 1.20 Jun-03 Source of data Datastrofes FedEx Aug-02 Sep-00 Od-03 Nov.co Deco 1.25 EXHIBIT 1 | UPS and FodEx Price Patterns June 2003 to June 2004 S&P 500 UPS Jan-04 Feb-04 Mar-04 Apr-04 May-04 Jun-04 14.11 2.42 0.06 07 0.92 2.92 0:34 EXHIBIT 2 | Financial and Analytical Ratios for FedEx FEDEX CORP 1992 1999 1994 1995 1995 1997 1998 1999 2000 2001 2002 2003 Activity Analysis Average days outstanding 44.10 42.00 41.82 41.79 42.67 30.74 44.57 46.90 45.00 44.25 41.54 365/receivables turnover Working capital turnover (4221) (617.85) 37.64 103.73 93.51 67.84 208.05 47.00 46.37 38.37 28.50 37.11 Fixed assets turnover Sales average networking capital 221 2.25 2.46 2.53 2.50 2.49 2.67 2.50 2.58 2.48 2.50 Sales averago net fixed assets Total asset turnover 1.38 1.35 1.42 1.40 1.53 1.51 1.64 150 1.58 1.47 1.49 1.46 Sales/average total assets Liquidity Analysis Current ratio 0.87 0.90 1.15 1.05 1.07 1.00 1.03 1.13 1.06 1.25 1.10 Current assets/current fab Cash ratio 0.08 0.11 0.26 0.20 0.00 0.00 0.12 0.02 0.04 0.11 (Cash + k secureur. lib. Cash from operations ratio 0.38 0.50 0.50 0.50 0.58 0151 0.61 0.64 0.55 0.83 0.76 0.58 Defensive interval Cash from operations curtilab 0.70 0.78 0.91 0.60 0.72 0.80 0.92 0.94 0.92 1.02 (Cash + AR cash taxes Crents gross CAPEX) Long-Term Debt and Solvency Analysis Debtequity ratio 1.24 1.21 0.95 0.70 0.52 0.51 0.41 0.20 0.37 0.30 0.28 Times Interesteamed Total debt total equity 1.30 3.79 4.31 5.00 6.42 7.78 7.83 6.50 8.00 10.51 EBIT interest expense Fixed-charge coverage ratio 0.46 0.64 0.65 0.61 0.57 0.74 0.75 0.72 0.65 0.65 0.89 Capital expendhure ratio EBITArenalesand int. exp.) 0.15 0.21 0.22 0.28 0.23 0.92 0.20 0.27 0.23 0.25 0.27 0.22 Cash from operations CAPEX Cash from operations debt ratio 0.27 0.30 0.42 0.65 0.71 0.00 1.04 0.91 0.90 1.23 0.93 Cash from operations total debt Profitability Analysis Margin before interest and tax 3.67% 4.67% 6.29% 6.07% 5.94% 6.82% 6.93% 6.69% 6.09% 5.79% 5.54% EBIT sales Net profit margin (1.519) 0.89% 2.415 3.17% 3.00% 3.14% 3.17% 3.79% 2.98% 3.45% 3.00% Nat incoma/sales Return on assets 1.63% 4.38% 6.45% 7.00% 6.75% 6.51% 8.94% 7,33% 7.32% 5.74% 6.38% 6.30% (NI+int exp.Yavg. total 590 Return on total equity (7.20%) 3.22% 10.62% 13.25% 11.95% 12.10% 12.70% 13.54% 14,33% 9.90% 10.88% 11.30% Net income average total equity Financial leverage effect (21.85%) 7.43% 26.64% 28.67% 32.51% 35.00% 29.48% 35.63% 42.35% 28.50% 31.87% 44,36% Net Income operating income Growth 92-93 93-94 94-95 95-96 96-97 '97-'98 95-99 99-00 00-01 '01-'02 02-03 CAGR (92-03) Sales 3.42% 8.60% 10.70% 9.39% 12.13% 37.79% 5.67% 7.52% 4.00 9.12% 11.53% (92-03) Book assets 8.04% 3.44% 7.3% 4.13% 13.83% 27.02% 9.99% 3.25% 15.73% 3.54% 11.32% 0.81% (02-03) Net Income bel unusual (186.51%) 68.11% 45.61% 3.42% 17.37% 37.91% 25.73% 9.09% (15.10%) 24.07% 14,48% 25.20% (93-03) gain) loss Not income (167.34%) 279.40% 45.61% 3.42% 17.37% 39.26% 25.51% 3.03% (15.10%) 21.50% 16,90% 35.51% (93-03) Operating income 31.67% 45.51% 11,40% 5.53% 0.65% 58.27% 7.43% 49% (2.14%) 0.10%) 23.30% 13,64% (92-03) Source of data: DataStream (Thomson Financial) 1.29 5.28% 8.64% EXHIBIT 3 | Financial and Analytical Ratios for UPS 1989 1994 1987 1005 1990 1992 1996 1999 2009 2000 2002 UPS 2001 54.92 25.66 37.60 34.8% 385 20.01 181.79 23.13 23.11 26778 4,748.29 2.50 2.63 1.00 30.50 33.63 2.34 1.80 39.67 3.00 2.54 1.17 44.70 11.55 241 53.16 10.33 220 1.24 51.60 7.72 241 1.10 365/receivables tumever Salaverage networking capital Saleverage met fredsats Salaverage totale 2.19 2.04 2.62 1.75 2.18 1.45 2.30 1.10 1.50 141 Activity Analysis Average days outstanding Working call mover Fixed assets turnover Total asset tumover Liquidity Analysis Current ratio Cash ratio Cash from operations ratio Defensive interval 1.03 1.35 1.00 0.12 0.74 0.00 1.04 0.09 0.56 147 1.00 0.07 0.86 0.12 1.32 0.14 0.73 1.50 148 0.44 0.77 3.12 205 1.50 0.59 5.13 1,58 0:43 0.61 3.07 1.64 0.35 0.94 2.82 1.57 0.54 1,01 1.79 0.72 0.54 457 Current sturen Cashme. Secursuri Cash from operations out, tab. Cash + AR + cash rents gross CAPE 0.80 1.30 1.36 1.71 17.10 0.50 16.00 16. 0.29 0.75 0.37 23.15 23.15 0.25 36.41 30.41 0.33 Total del quity El pense Errental exp. and Inte) Cash from operations CAPEX Cash from operational debt 0.00 Long-Term Debt and Solvency Analysis Deguity ratio 0.23 0.22 0.24 0.34 0.44 0.45 0.35 0:37 Times interes med 188 23.60 2015 13.71 730 12.17 16.00 19.50 Fecharge coverage ratio 18.60 23.59 20.05 17.19 13.71 730 12.17 15.00 13.50 Caphal expendhure rato 0.23 0.25 0.21 0.22 0.19 0.22 0.25 0.10 0.22 Cash from operation/debt ro 1.67 2.04 1.43 1.13 0.74 0.00 1.10 0.76 Profitability Analysis Margin before interest and tax 7.74% B.20% 7.95% 10.29% 0.07% 7.50% 12.47% 14.74% 15.1046 Net proft margin 3.12% 4.55% 4.63% 4.00% 5.12% 4,05% 7,02% 3.20% 9.86% Rotum on assets 8:47% 9.10% 9.10% 9.24% 0.65% 7.16% 11.00% 4015 54.57% Return on total equity 13.07% 20.53% 20.30% 20.25% 10.42% 14.03% 24.27% 7.00% 30.14% Financial leverage effect 35.50% 46.16% 58.30% 59.41% 60.56% 36.62% 60.70% 39.724 107.00% Growth 92- "93-94 94-95 95-95 '97-06-09 99-00 Sale 7.05% 10.00 7.51% 0 AOS 10.37% 2.53% 50.00% Book assets 5.93% 10.00% 19.00% 16265 0419 7.25% 3.01% 15.90%) Net Income bal unutual gains 5.00% 16.51% 10.57% 9.80% cas)01.59% 49,21%) 232-20% Net Income 56.86% 15.51% 10.57% 2.880.88%) 91.59% 49,28%) 232. 20% Opting Income 14.00 6.74% 39.21% -33% 116.39%) 1.00% 20.00% 13.30 12.00% 7.80% 10. 23.41% 51515 1281% 13.16% 10.10% 8.85% 12.73% 10.44% 25.55% 10.515 56.55% 2.3% EB Tales Net Income sales Ninexp av totales Net Income average total equity Not incomaloperating income CAGR 06-01 05-02 02-05 2.045 2.049 7.00% 13.73% 8.00 B.com (17.35%) 34.19% (0.045) (18.29%) 32.605 08.03N) (1400) 3.01 10.01% 7.32% (2-0) 8.125 192-03 14.25% 192-03) 09046 02-03 12.5% 22-03) United Parcel Service, Inc. Establishes next day air service EXHIBIT 4 Timeline of Competitive Developments FedEx Corp. Offers 10:30 A.M. delivery 1982 Acquires Gelco Express and launches 1984 operations in Asia-Pacific . Establishes European hub in Brussels 1985 Introduces handheld barcode scanner 1986 to capture detailed package Information Offers warehouse services for IBM, 1987 National Semiconductor, Laura Ashley 1988 Begins intercontinental air service between United States and Europe . 1989 . Acquires Tiger International to expand its International presence Wins Malcolm Baldrige National Quality Award 1990 1991 Offers two-day delivery 1992 1993 1994 1995 Establishes UPS's first air fleet Offers automated customs service Expands international air service to 180 countries Introduces 10:30 A.M. guarantee for next-day air . Begins Saturday delivery Offers electronic-signature tracking Expands delivery to over 200 countries Provides supply-chain solutions through UPS Logistics Group Launches Web site for package tracking Offers guaranteed 8 AM, overnight delivery Makes UPS stock available through a public offering Acquires all-cargo air service in Latin America Acquires Mail Boxes Etc. retail franchise Begins direct flights to China . Offers guaranteed next-day home delivery . Contracts with Yangtze River Express for package delivery within China Reduces domestic ground-delivery time 1999 Launches Web site for package tracking Acquires air routes serving China Establishes Latin American division Creates new hub at Roissy-Charles de Gaullo Airport in France Launches business-to-consumer home-delivery service Carries U.S. Postal Service packages Acquires American Freightways Corp. Expands home delivery to cover 100% of the U.S. population Acquires Kinko's retail franchise Establishes Chinese headquarters 2000 2001 2002 2003 NA EXHIBIT 5 Summary of Announced List-Rate Increases UPS 1998 1999 2000 2001 2002 2003 2004 Average Date implemented 2/8/02 2/9/03 278/04 2/6/051/8/06 1/7/07 1/6/08 UPS ground 3.6% 2.5% 3.1% 3.1% 3.5% 3.9% 1.9% 3.1% U.S. domestic air 3.3% 2.5% 3.5% 3.7% 4.0% 3.2% 29% 3.3% U.S. export 0.0% 0.0% 2.9% 2,9% 3.9% 2.9% 2.9% 2.2% Residential premium $1.00 $1.00 $1.00 $1.05 $1.10 $1.15 $1.40 Commercial premium NA N/A NA NA NA $1.00 FedEx 1998 1999 2000 2001 2002 2003 2004 Average Date implemented 2/16/02 2/9/03 2/2/04 2/2/05 118/06 1/7/07 1/8/08 FedEx ground 3.6% 2.5% 3.1% 3.1% 3.5% 3.9% 1.9% 3.1% U.S. domestic alr 3.5% 2.8% 0.0% 4.9% 3.5% 3.5% 2.5% 3.0% U.S. export 0.0% 0.0% 0.0% 2.9% 3.5% 3.5% 2.5% 1.8% Residential premium-express NIA NA NA N/A $1.35 $1.40 $1.75 Residential premium-ground NIA NA NA $1.30 $1.35 $1.40 $1.75 Residential premium-home delivery NA NA NA $1.05 $1.10 $1.15 $1.40 Commercial premiurn-express NA NA NA NA $1.50 $1.75 $1.00 Commercial premium-ground? NA NA NA NA NA NA $1.00 Sources of data:UPS, FedExand Morgan Stanley The residential premium was an additional charge for deliveries of express letters and packages to residential addresses, a price distinction UPS had applied to residential ground deliveries for the previous 10 years to offset the higher cost of providing service to thern *The commercial premium was applied to products shipped to remote locations and or select zip codes. EXHIBIT 6 Cumulative Capital Expenditures for FedEx and UPS $25.0 $20.0 FedEx Corp $15.0 Billions (USS) United Parcel Service $10.0 $ 5.0 $ 0.0 2661 1994 1996 1997 1998 1999 2000 2001 2003 1993 1995 2002 Sources of data: Company regulatory filings 2002 2003 15,968 17,277 8,627 9,900 EXHIBIT 7 Geographic Segment Information (values in millions of U.S. dollars) FedEx Corp. 1992 1993 1994 1995 1996 1997 1998 1999 2000 2001 U.S. domestic Revenue 5,195 5,868 5,195 6,839 7.466 8,322 9,665 12,910 13,805 14,858 Identifiable assets 3,941 4,433 4,384 5,322 5,449 6,123 6,873 6,506 7,224 8,637 International Revenue 2,355 2.140 2,280 2,553 3,198 3,589 3,863 4,452 4,771 Identifiable assets 1.522 1,360 1.109 1,112 1.250 1,503 1,503 1,001 1,018 1,254 Consolidated Revenue 7,550 7,808 7,474 9,392 10,274 11,520 13,255 16,773 18,257 19,629 Identifiable assets 5,463 5,793 5,992 6,433 6,699 7,625 8,376 7,507 9,891 United Parcel Service Inc. 1992 1993 1994 1995 1996 1997 1998 1999 2000 2001 2,807 4.639 1,520 5,210 1,536 8.242 20,607 22,487 10,147 11.444 2002 2003 14,722 15,823 17,298 18,243 20,108 7,873 8.539 9,902 11,157 9,376 20,238 22,252 24,093 10.063 9,832 10,725 26,325 26,163 12,477 13,717 26,284 26,968 14,129 14,915 8,517 U.S. domestic Revenue Identifiable assets International Revenue Identifiable assets Consolidated Revenue Identifiable assets 1,960 1,214 1,797 1,164 2.278 1,200 2.802 1,488 2.260 1,323 2,220 1,372 2,536 1,810 2,959 2,111 3,446 2,061 4,158 3,050 4,988 2,874 3,567 22.458 24,788 27,052 29,771 30,321 11,435 11,642 12,836 14,538 16,767 31.272 33,485 17,003 18,482 16,519 17.782 19,576 21,045 22,368 9,038 9,754 11,182 12,645 10,699 Sources of data: Company regulatory filings. * FASS Statement No. 13: (Disclosures about Segments of an Enterprise and Related Information), established the standard to be used by enterprises to identity and report Information about operating segments and for related disclosures about products and services, geographic areas, and major customers $1.35 18.70 EXHIBIT 8 Equity Prices and Returns for FedEx and UPS United Parcel Service, Inc. 1992 1993 1994 1995 1996 1907 1998 1999 2000 2001 2002 2003 Stock pricel, December 31 $0.25 $10.38 $11.75 $13.13 $14.63 $15.38 $20.00 $69.00 $58.75 $54,80 $63.08 $74.55 Dividends per share! 50.26 $0.25 $0.28 30.32 $0.34 $0.35 50.22 $0.58 $0.68 $0.76 $0.78 $0.92 EPS, basic incl. extra items! $0.44 30.70 $0.81 $0.92 $1.00 $0.82 $1.59 $0.70 $2.54 $2.13 $2.84 $2.57 P/E multiple 21.26 14.82 14.42 14.34 14.55 18.64 12.58 87 34 23.13 25.59 22.21 29.01 Capital appreciation 12.16% 13.25% 11.70% 11.43% 5.13% 30.08% 245.00% (54.86%) (7.23%) 15.74% 18.18% Cumul compound annual return 12.10% 27.03% 41.09% 53.11% 85.22% 110.22% 045.95% 535.14% 400.19% 501,05% 705.05% FedEx Corp 1992 1993 1994 1995 1096 1997 1998 1999 2000 2001 2002 2003 Stock price, December 31 $10.19 $12.25 $19.13 $14.97 $19.10 $26.19 532.00 $54.61 $35.50 540.00 553.95 $63.90 Dividends per share 55.00 50.00 $0.00 30.00 $0.00 30.00 $0.00 $0.00 50.00 $0.00 $0.00 $0.20 EPS, basic incl. extra tems (30.53) 50 25 $0.91 31.32 $1.56 $1.72 $2.13 $2.30 32.02 $2.38 $2.79 P/E multiple 50.00 20.06 11.36 14.22 10.70 25.73 15.04 19.00 22.07 22.93 Capital appreciation 20.25% 56.12% (21.73%) 27.97% 36.70% 22.43% 70.98% 135.23%) 12 60% 34.68% 18.50% Cumul compound annual return 20.25% 87.73% 40,93% 18.04% 157.00% 214.72% 438,04% 248.47% 292.64% 429.57% 528.02% Standard & Poor's 500 index 1992 1993 1094 1995 1996 1997 1998 1990 2000 2001 2002 2003 Index level 435.71 488,45 450.27 615.93 740.74 70.43 1.220.23 1.400.25 1.320.20 1,140,00 870.82 1.111.02 Annual return 7.00% (1.54%) 34.11% 20.26% 31.01% 20.07% 19.53% (10.14%) (13.04%) (23.37%) 26.30% Cumul compound annual return 7.06% 5.41% 41.38% 70.01% 122.72% 102.12% 237 2196 203.02% 163.50% 101.93% 156,20% Cumul. Market Adjusted Returns 1993 1904 1995 1906 1997 1998 1999 2000 2001 2002 2005 UPS 5.11% 21.62% 0.53% (11.90%) (56.51%) (65.90%) 408.74% 332.12% 325.60% 480.02% 350.78% FedEx 13.10% 82.32% 5.57% 18.00% 34 33% 32.00% 200.85% 45.45% 120.14% 327.64% 372 83% Source of data: Standard & Poor's Research Insight annual reports, These data have been adjusted for the two for one stook split and initial public offering completed by UPS in November 1999. Prior to 1999, UPS shares were not publicly traded and the company acted as a market-maker for its own stock Compound annual return calculation: (Current year price-Beginning year pricey Beginning year price 2001 2003 1998 2000 2002 1905 1996 1990 1997 $137 $405 $4.555 8.70% $419 $5.081 8.25% 3499 $5.663 8.82% $727 $8.882 10.56% $725 $7,863 9.23% 5866 $8,630 10.03% $750 $10,090 7.43% $851 $10.870 8.10% $1418 $12,050 11.77% $1,325 51,385 $1,800 298 205 $1,325 225 $15 $3,363 43% 7.01% 8.27% 5.6% 1.20 13.73% 11.18% $19 34,369 43% 7.07% 8.46% 5.6% 1.40 14.91% 12.56% EXHIBIT 9 Economic Profit Analysis for FedEx FedEx Corp. 1902 1993 1994 Return on Net Assets(RONA) Net Operating profit after tax (mm) 5176 5363 Beginning capital (mm) $4,070 $4,344 $4,456 RONA (NOPAT/beginning capital) 4.59% 4.05% 8.16% Weighted Average Cost of Capital (WACC) Long-term debt (mm) $1,798 $1,882 51.632 Shares outstanding (mm) 216 210 224 Share price ($) $10 $12 $10 Market value of equity (mm) $2,205 $2,692 34274 Tax rate (%) 23% 46% 40% Long-term U.S.govt. bonds (%) 7.97% 6.80% 7.53% Senior Bas-rated debt (%) 9.20% 8.11% 8.71% Risk premium (%) 5.6% 5.6% 1.10 1.15 1.20 Cost of equity (%) 14,13% 13.24% 14.25% WACC 10.00% 9.72% 11.61% Economic Value Added (EVA) RONA (NOPAT/beginning capital 4,59% 4.05% 8.16% WACC 10.90% 0.72% 11.81% Spread (6.39%) (5.67%) (3.40%) X beginning capital (mm) $4,078 $4,344 $4,455 EVA (annual) ($261) ($246) ($154) EVA (cumulative) ($261) (5507) (5661) Market Value Added (MVA) Market value of equity (mm) $2,205 $2.682 34.274 Long-term debt mm) 1.798 1.882 1,632 Capital (market value) (m) 4,002 4,565 5.907 Book value of equity (mm) 1,580 5.671 1,025 Long-term debt fimm 1.792 1,882 1632 Capital (bock valve) (mm) 3,378 3,554 3.557 MVA (market value-book value) 5625 $1,011 $2,350 $1,390 230 $26 $6,018 43% 6.89% 8.16% 5.6% 1.35 14.45% 12.61% $32 59,455 45% 5.94% 7.33% 5.6% 1.30 13.22% 12.05% $1,360 $1,776 298 284 $55 $36 $16,333 $10,098 39% 5.79% 6.19% 7.69% 8.87% 5.6% 5.6% 1.15 1.20 12.23% 12.01% 11.64% 11.79% $1,900 207 $40 $11,893 37% 5.65% 7.94% 5.6% 1.20 12.37% 11.35% $16,087 38% 5.55% 7.98% 5.8% $1,709 299 $64 $19,104 38% 4.75% 6.58% 5.6% 1.10 10,92% 10.36% 5.8% 1.20 Beta 12.27% 11.53% 11.77% 10.36% 8.70% 11.18% (2.40%) 54,055 (S115) (5777) 8.29% 12.56% (4.30%) $5,081 (5219) ($995) 8.82% 12.61% (3.70% $5,663 ($215) ($1,210) 10.58% 12.05% (1.48%) $8.882 ($102) ($1,312) 9.23% 10.03% 7.43% 11.64% 11.79% 11.35% (2419) (1.75%) (3.92%) $7.863 58636 $10,000 ($190) ($151) ($396) (51,502) ($1,653) ($2,049) 8.10% 11.53% (3.43%) $10,870 (5373) (52,422) $12,050 $170 ($2,252) 53,363 $8,010 1.398 7.416 $11.93 1.900 13.793 $9.453 1,385 10.30 1.325 $19,104 1,709 20,813 4,697 $4,359 1325 5,684 2.576 1325 3,901 $1,783 $18,333 $10,000 1.350 1.776 17,683 11,874 4,785 1,360 1.776 5.023 6,561 $11,670 $5,313 $16.087 1.800 17.687 6.545 1.800 3,345 $9,542 2.246 1325 3,570 $1,117 2,963 1.300 4300 $3,056 5 900 1.900 7,001 $5,993 3.000 1385 5,345 $5,492 7.280 1,709 8.907 $11,816 Sources of data: Value Line Investment Survey, Standard & Poor's Research Insight Bloomberg LP, Datastream *The cost of equity was derived using the capital asset pricing model (CAPM). 1990 1997 1995 1996 2003 2000 2001 2002 1999 $589 $1,448 $9,879 14.96% 51.545 $11,796 13.10% 51,379 $12.514 11.02% 51.909 $13,350 14.30% 53.215 $2,955 $18.845 $17,161 17.06% 17.22% $2,846 $20,007 14.23% $2,589 $3.300 $20,802 523,391 12.45% 14.15% EXHIBIT 10 Economic Profit Analysis for UPS United Parcel Service, Inc. 1992 1993 1994 Return on Net Assets (RONA) Nat operating profit after tax (mm) $914 $944 Beginning capital (m) $5,932 $7.195 $8.280 RONA (NOPAT/beginning capital 13.19% 12.34% 11.40% Weighted Average Cost of Capital (WACC) Long-term debt (mm) $862 $852 $1,127 Shares outstanding' (mm) 1,100 1.160 1,180 Share price(s) 30 $10 $12 Market value of equity' (mm) $11,000 $12,035 $13,630 Tax rato (%) 40% 43% 40% Long-term U.S.govt. bonds (%) 7.07% 6.80% 7.53% Senior Bas-rated debt (%) 8.34% 7.38% 8.00% Risk premium (%) 5.6% 5.6% 5.6% Beta 1.24 1.13 1.16 Cost of equity (%) 14.92% 13.15% 14.02% WACC 14,20% 12.58% 13.32% Economic Value Added (EVA) RONA (NOPAT/beginning capital) 13.18% 12.34% 11.40% WACC 14,20% 12.58% 13.32% Spread (1.01%) (024%) (1.91%) X beginning capital (mm) $8.932 $7,195 $8.280 EVA (annual) (mm) (570) ($17) (5158) EVA (cumulative) (mm) (570) (587) (5246) Market Value Added (MVA) Market value of equity (mm) $11,000 $12,035 $13,630 Long-term debt mm 862 852 1.127 Capital market value) (mm) 11,870 12.887 14.757 Book value of equity (mm) 3,720 3,945 4,847 Long-term debt mm 852 1,127 Capital (book value) (Sm 4.50 4.797 5.775 MVA (market value-book value) $7,287 $8,090 $8,003 $1,729 $2.573 1,140 1.140 $13 $15 $14,063 $16,673 39% 40% 7.01% 7.07% 7.71% 7.78% 5.6% 5.6% 1.18 13,64% 13.68% 12.72% 12.47% $2,583 $2,191 1.124 1.095 $15 $20 $17.282 $21,800 41% 40% 6.89% 5.94% 7.53% 6.71% 5.5% 5.6% 1.08 13.27% 11,99% 12.12% 11.26% $1.912 1,211 $89 $83,530 58% 5.79% *6.90% 5,6% 1.15 12.23% 12.02% $2,981 1.135 559 $86,663 39% 6.19% 7.99% 5.6% 1.11 12.41% 12.09% $4,648 1.125 $55 $65,068 38% 5.65% 7.18% 5.6% 1.09 11.75% 11.23% $3,495 1.123 563 $70,839 35% 5.55% 8.68% 5.6% 0.95 10.67% 10.56% $3,149 1.129 $75 $84.167 34% 4.76% 5.47% 5.6% 0.80 9.24% 9.04% 1.18 14.15% 14,90% 13.10% 12.72% 12.47% 224% 0.63% $9.679 $11,796 5217 574 (528) $45 11.02% 14.30% 12.12 11.26% (1.10%) 3.04% $12.514 $13,350 (5138) (592) $313 17.06% 17 22% 12.02% 12.09% 5.04% 5.13% $10.845 $17,161 $9.49 $081 $1,262 $2,143 14.23% 11.23% 299% $20.007 $599 52,741 12.45% 10.56% 1.80% $20.802 $392 $3,133 5.11% $23 393 $1,195 $4328 $405 551,060 65,716 $14.983 $16,673 1.729 2.573 16,692 19.246 5,151 5,901 1729 2.573 6,880 8,474 $0,812 $10,772 $17.282 2,583 19.865 0.007 2,583 8.670 $11,195 $21.090 $83.538 2.191 1.912 24,087 85.450 7.173 12,474 2 191 1912 9,364 14,386 $14,723 $71,064 $66.663 2,083 69,544 9,735 2.981 12,716 $50,028 570 839 $84.167 3495 3.149 74,334 87,310 12.455 14,852 3.495 3.149 15,950 18,001 $58,384 569,315 10,245 4,548 14,896 $50,820 862 Sources of data: Valve Line Investment Survey, Standard & Poor's Research Insight, Bloomberg LP. DataStream These data have been adjusted for the two-for-one stock spilt and initial public offering completed by UPS in November 1999. Prior to 1099, UPS shares were not publicly traded and the company acted as a market-maker for its own stock For the period 1992-2001, this figure reflects the average betas for peer firms The cost of equity was derived using the capital asset peling model (CAPM) EXHIBIT 11 | Equity Analysts' Outlook for FedEx and UPS FedEx Corporation Analyst Comments Morgan Stanley's It was refreshing to hear FedEx's management highlight some of the risks in China as J.J. Valentine, we sense these issues are too often overlooked by the bulls. Some of these issues April 6, 2004 include: . lack of legal framework different interpretations of laws by regional and local governments . nonperforming loans that put pressure on China's banking sector liability by government for retirement program of state-owned enterprises widening gap between the urban and the rural standard of living government that often dictates commercial relationships One issue that's not as much a risk as it is a challenge is finding skilled, educated labor. This was a recurring theme that we heard during our visit to Asia, namely that China has a large unskilled workforce to produce cheap products, but it is becoming increasingly difficult to find skilled labor for the service industry, such as parcel delivery or logistics. Value Line The International business should drive long-term growth. Unlike the domestic Investment express business, which has reached maturity, the international market remains in the Survey's growth stage. Indeed, growth rates in this sector mirror the rate of domestic expansion W.R. In the late 1980s. Furthermore, demand for this service should rise going forward, as Perkowitz Jr. a greater amount of manufacturing capacity is outsourced to Asia. Finally, since a Dec. 12, 2003 large portion of FedEx's cost structure is fixed, and it has ample capacity to serve additional business, any increases in volume should flow directly to the bottom line. United Parcel Service Inc. Analyst Comments Value Line United Parcel Service's third-quarter 2003 results were better than we expected.... Investment This gain was driven by record-breaking results in the international and nonpackage Survey's segments. Indeed, both units experienced advances in volume and margins, which led D. Y. Fung, to bottom-line increases of 171% and 61% respectively. Importantly, growth of these Dec. 12, 2003 two businesses has resulted in greater earnings diversity at UPS. This has helped to protect investors from the cyclical downturn in the U.S. economy in the past two years. Going forward, we believe International and nonpackage will continue along their posl- tive growth trajectory, while generating a higher portion of the company's net earnings. Marking Scheme: Fedex vs. UPS [Write your answer in the boxes below] Task: You are financial analyst working for WB. WB is interested in investing air transportation companies and has shortlisted Fedex and UPS for consideration. WB has assigned you to research the 2 firms and report to him for your findings. Perform comparative fundamental value analysis of Fedex and UPS with an emphasis on their potentials for Max: fundamental value creation. Write a short report on your 50 findings. Marks Type your answer below: [Word limit: 100 words] Specifically, WB is interested in financial resources to finance growth. Perform relevant fundamental analysis as well as market valuation (multiples e.g., P/B, P/E) evaluation of UPS and Fedex and report your findings. Max: 50 Marks Type your answer below: [Word limit: 100 words) The Battle for Value, 2004: FedEx Corp. vs. United Parcel Service, Inc. FedEx will produce superior financial returns for shareoners by providing high value-added supply chain, transportation, business, and related information services through focused operating companies competing collectively, and managed collaboratively, under the respected FedEx brand. FedEx Mission Statement (Excerpe We serve the evolving distribution, logistics, and commerce needs of our customers worldwide, offering excellence and value in all we do. We sustain financially strong company, with broad employee ownership, that provides a long-term competitive return to our shareowners UPS Mission Statement (Excerpt) On June 18, 2004, the United States and China reached a landmark air-transportation agreement that quintupled the number of commercial cargo flights between the two countries. The agreement also allowed for the establishment of air-cargo hubs in China and landing rights for commercial airlines at any available airport. The pact represented the most dramatic liberalization of air traffic in the history of the two nations, and FedEx Corporation and United Parcel Service, Inc. (UPS), the only U.S. all-cargo carriers then permitted to serve the vast Chinese market,' were certain to be the primary beneficiaries of this opportunity News of the transportation agreement did not come as a major surprise to most observers as U.S. and Chinese negotiators had been in talks since at least February The stock prices of both companies had been rising steadily since those talks began, Northwest Airlines served China through both all cargo and all passenger services. but FedEx's share price had socketed at a rate nearly five times faster than UPS's? Exhibit 1 presents an illustration of recent stock-price patterns for the two firms relative to the S&P 500 Index. FedEx had the largest foreign presence in China, with 11 weekly flights almost twice as many as UPS. The company served 220 Chinese cities, and flew directly to Beijing. Shenzhen, and Shanghai, FedEx's volumes in China had grown by more than 50% between 2003 and 2004. While UPS tagged behind FedEx in the Chinese market, it was still the world's largest package-delivery company and the dominant parcel carrier in the United States. UPS had been active in China since 1988 and was the first carrier in the industry to offer nonstop service from the United States. By 2003, UPS had six weekly Boeing 747 flights to China, with direct flights to Beijing and Shanghai, serving nearly 200 cities. UPS reported a 60% growth in traffic on its principal U.S.-Shanghai route since initiating that service in 2001, and it predicted that peak season demand would exceed its capacity As the U.S. package-delivery segment matured, the international markets--and espe cially China-became a battleground for the two package-delivery giants. PodEx had vir tually invented customer logistical management, and was widely perceived as innovative, entrepreneurial, and an operational leader. Historically, UPS had a reputation for being big, bureaucratic, and an industry follower, but "Big Brown" was aggressively shod- ding its plodding image, as it too became an innovator and a tenacious adversary, UPS had recently undergone a major overhaul of its image, and was repositioning itself as a leading provider of logistics and supply chain management services The 2004 air-transportation agreement between China and the United States was a watershed moment for the international package-delivery business--more than 100 new weekly all-cargo flights were up for grabs with the United States largest trading partner. There was, however, no guarantee for exactly how those new cargo routes would be allocated between UPS and FedEx, companies that had been battling each other for dominance for more than 30 years. Moreover, the eventual assignment to the region of other carriers would test each company's ability to fend off emerging competitive threats. Against this backdrop, industry observers wondered how the titanic struggle between FedEx and UPS would develop. particularly for investors in the two firms. Was the performance of the companies in recent years predictive of the future? Success in China was widely seen as the litmus test for corporate survival in the new millennium. Which company was better positioned to attract the capital necessary to win this competitive battle? FedEx Corporation FedEx first took form as Fred Smith's undergraduate term paper for a Yale University economics class. Smith's strategy dictated that FedEx would purchase the planes that it required to transport packages, whereas all other competitors used the cargo space Between February 18 and June 18, 2008, PodEx's stock price rose 13.9%, whereas UPS's grow 3.1% Fede available on passenger airlines. In addition to using his own planes, Smith's key inno vation was a hub-and-spoke distribution pattern, which permitted cheaper and faster service to more locations than his competitors could offer. In 1971, Smith invested his $4-million inheritance, and raised $91 million in venture capital to launch the fimm--the largest venture capital start-up at the time. In 1973, on the first night of continuous operation, 389 FedEx employees deliv- cred 186 packages overnight to 25 U.S. cities. In those early years FedEx, then known as Federal Express Corporation, experienced severe losses, and Smith was nearly Ousted from his chair position. By 1976. FedEx finally saw a modest profit of $3.6 million on an average daily volume of 19,000 packages. Through the rest of the 1970s, FedEx continued to grow by expanding services, acquiring more trucks and aircraft, and raising capital. The formula was successful. In 1981, FedEx generated more revenue than any other U.S. air-delivery company By 1981, competition in the industry had started to rise. Emery Air Freight began to imitate FedEx's hub system and to acquire airplanes, and UPS began to move into the overnight air market. The United States Postal Service (USPS) positioned its overnight letter at half the price of FedEx's, but quality problems and FedEx's "absolutely positively overight" ad campaign quelled that potential threat. In 1983, FedEx reached $1 billion in revenues and seemed poised to own the market for express delivery During the 1990s, FedEx proved itself as an operational leader, even receiving the prestigious Malcolm Baldrige National Quality Award from the President of the United States. FedEx was the first company ever to win in the service category. Part of this success could be attributed to deregulation and to operational strategy, but credit could also be given to FedEx's philosophy of "People-Service-Profit." which reflected its emphasis on customer focus, total quality management, and employee participation. Extensive attitude surveying, a promote-from-within policy, effective grievance procedures that sometimes resulted in a chat with Fred Smith himself, and an emphasis on personal responsibility and initiative not only earned FedEx a reputation as a great place to work, but also helped to keep the firm largely free of unions. FedEx's growth occurred within the context of fundamental change in the busi- ness environment. Deregulation of the domestic airline industry permitted larger plants to replace smaller ones, thereby permitting FedEx to purchase several Boeing 727s, which helped reduce its unit costs. Trucking industry deregulation also permitted FedEx to establish an integrated regional tracking system that lowered its unit costs on short-haul trips, enabling the company to compete more effectively with UPS Rising inflation and global competitiveness compelled manufacturers to manage inventories more closely and to emulate the just-in-time (JIT) supply programs of the Japanese, creating a heightened demand for PodEx's rapid and carefully moni tored movement of packages. And, finally, technological innovations enabled FedEx to achieve important advances in customer ordering, package tracking, and process monitoring By the end of 2003, FedEx had nearly $15.4 billion in assets and not income of $830 million on revenues of about $22.5 billion. Exhibit 2 provides FedEx's 56 Part One Setting Some Themes financial and analytical ratios. The company had about 50,000 ground vehicles, 625 er- craft, 216,500 full- and part-time employees, and shipped more than 5.4 million pack- ages daily. United Parcel Service, Inc. Founded in 1907. United Parcel Service, Inc., was the largest package-delivery com- pany in the world. Consolidated parcel delivery, both on the ground and through the air, was the primary business of the company, although increasingly the company offered more specialized transportation and logistics services. Known in the industry as Big Brown, UPS had its roots in Seattle, Washington, where 19-year-old Jim Casey started a bicycle-messenger service called American Messenger Company. After merging with a rival firm, Motorcycle Delivery Company, the company focused on department store deliveries, and that remained true until the 1940s. Rentmed United Parcel Service of America, UPS started an air-delivery serv- ice in 1929 by putting packages on commercial passenger planes. The company entered its strongest period of growth during the post-World War II cconomic boom and, by 1975, UPS had reached a milestone when it could promise package d
Step by Step Solution
There are 3 Steps involved in it
To perform a comparative analysis of FedEx and UPS its critical to delve into their financial statem... View full answer

Get step-by-step solutions from verified subject matter experts