

Question: Need ti know average return and standard deviation for each of the three sets of data. A rol Dre Yerd (ADP) the The AN, II

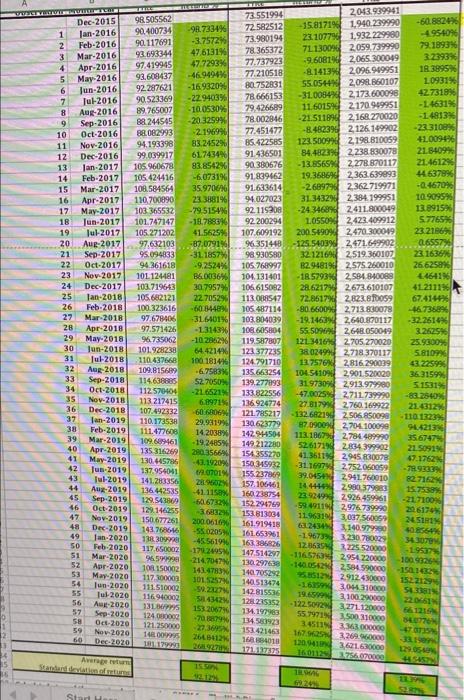
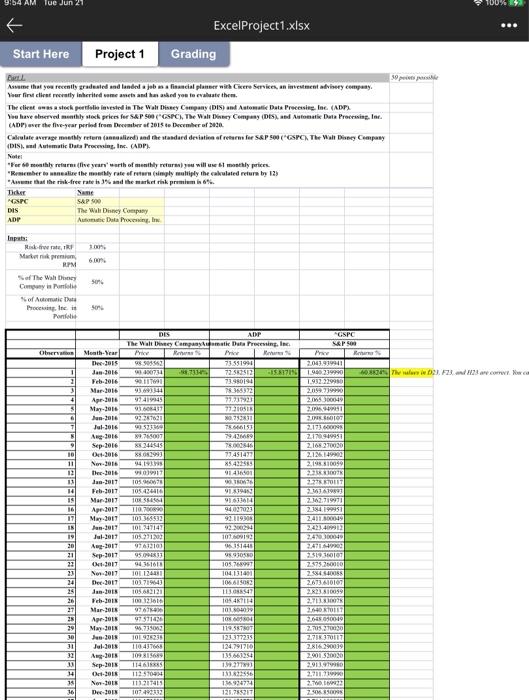
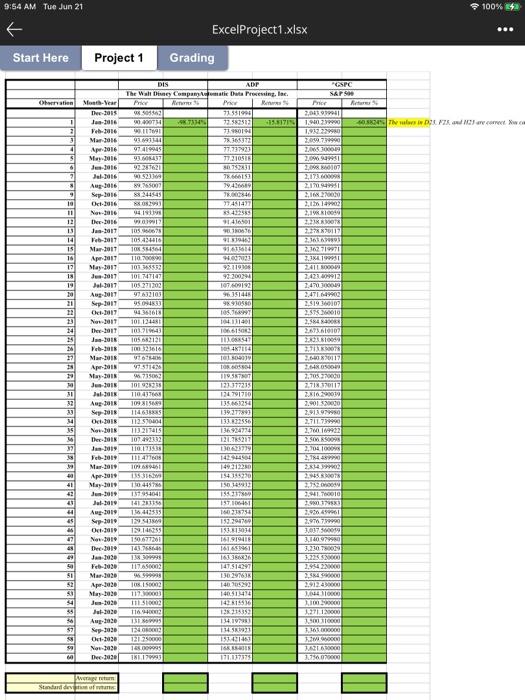
A rol Dre Yerd (ADP) the The AN, II 13 ape 16 p D-43B4- manne, repergured a vene GALL plezal van kyan L y The Way period of averago mwadily return (and) and the (0) of y LIIK Sen THE hining in 1 wag mong may pa AMALANG Sat M Q y grand landed a job A option whe www. N SHE 2 FINES W They Company otomat AA 201 3 E S D X afmonial planner with fres, comp th Ping y Company (1) and (XP) Processing be P100(CPC). The x command 1 4 C (3 R F N 5 V www.c 44 T G > 6 Lini ime MacBook Pro 4 Y MARC B 7 H n N a 8 J nie te Some Conta) 1 M 1 9 K 2,043.939941 PRYLLYBEASOOM 73.551994 Dec-2015 72.582512 -15.8171% 1,940.239990 1 Jan-2016 73.980194 2 Feb-2016 90.117691 3 Mar-2016 93.693344 4 Apr-2016 97.419945 5 May-2016 23.10779 1,932 229980 47,6131% 78.365372 71.1300% 2,059.739990 -9.6081% 2,065.300049 47.7293% 77.737923 77.210518 -81413% 2,096.949951 93.608437 92.287621 -46.9494% -169320% 80.752831 55.0544% 2,098.860107 6 Jun-2016 -31.0084% 2,173.600098 78.666153 -22.9403% 90.523369 7 Jul-2016 79,426689 -10.0530% 8 89.765007 Aug-2016 11.6015% 2.170 949951 -21.511896 2,168 270020 -20.3299% 78.002846 88.244545 9 Sep-2016 Oct-2016 77.451477 88.082993 -2.1969% 10 11 Nov-2016 85.422585 94.193398 83.2452% 61.7434% 12 99.039917 91.436501 Dec-2016 90.380676 83.8542% 13 Jan-2017 105.960678 91,839462 14 Feb-2017 15 Mar-2017 16 Apr-2017 17 18 -8.482396 2,126149902 123.500998 2,198.810059 84.48239 2,238 830078 -13.8565% 2,278.870117 19.36869 2,363.639993 91.633614 -2.6897% 2,362719971 94.027023 31.3432% 2,384.199951 92.119308 -24 3468% 2,411.800049 92.200294 1.0550 % 2,423.409912 107.609192 200.5490% 2,470.300049) 96.351448-125.540396 2471.649902 98930580 321216% 2,519.360107 -9.2524% 105.768997 82.9481% 2,575.260010 86.0036% 104.131401 -185793% 2,584.840088 30.7957% 106.615082 19 0.6557% 20 Aug-2017 23,1636% 21 105.424416 -6.0731% 108.584564 35.970696 110,700890 23.3881% May-2017 103.365532 -79.5154% Jun-2017 101.747147 -18.788396 Jul-2017 105.271202 41.5625% 97.632103 -87.0791% Sep-2017 95.094833 -31.1857% 22 Oct-2017 94.361618 23 Nov-2017 101.124481 24 Dec-2017 103.719643 25 Jan-2018 105.682121 Feb-2018 100.323616 -60 8448% Mar-2018 97.678406 -31.6401% 28 Apr-2018 97.571426 -1.3143 % May-2018 96.735062 -10 2862% 101.928238 64.4214% 110.437668 100 1814% 26.6258% 4.4641% 41.2111% 67.4144% 26 -46.7368% 22.7052% 113.088547 105.487114 103.804039 108.605804 28.6217% 2.673.610107 72.8517% 2,823.810059 -80.6600 % 2,713 830078 -19.1463% 2,640.870117 55.50969 2,648.050049 119.587807 121.3416 27 -32.2614% 3.2625% 29 2,705.270020 25.9300% 30 Jun-2018 3802499 2,718.370117 5.8109% 137576% 2,816.290039 43.22599 31 123.377235 124.791710 135.663254 Jul-2018 Aug-2018 109.815689 32 -6.7583% 104.5410% 2,901.520020 36.3159% Sep-2018 114.638885 52.7050% 5.1531% 112 570404 -21.6521% -83.2840% Oct-2018 Nov-2018 113.217415 Dec-2018 21.4312% 36 -1101323% 37 94.42139 38 35.6747% 39 139.277893 31.9730% 2,913.979980 133.822556 47.0025% 2,711.739990 6.8971% 136.924774 27.8179% 2,760 169922 107.492332 60.6806% 121.785217 -132.6821% 2.506.850098 Jan-2019 110.173538 29.9319% 130.623779 87.09009 2,704.100099 Feb-2019 111.477608 14.2038% 142944504 113.1867% 2,784 489990 Mar-2019 109 609461 -19,2485% 149 212280 Apr-2019 135.316269 280.3566% 154.355270 41 May-2019 130.445786 -43.1920% 150.345932 42 Jun-2019 137.954041 6907019 155.237869 43 Jul-2019 141.283356 28-9602% 157.106461 Aug-2019 136 442535) -41.1150% 160.238754 45 Sep-2019 129.543869 -60.6732% 152.294769 46 Oct-2019 21.5091% 40 47.1762% 52.617198 2834399902) 41.3611% 2,945 830078 -31.1697 2.752.060059 39.0454 2,941.760010 -78.9333% 82.7162% 14.4444 2.980.379883 15.7539% 44 23.92499 2,926.459961 -21.7100% 59.49119 2976.739990 20.6174% 129.146255 153.813034 11.96319 3,037.560059 24.5181% 47 Nov-2019 Dec-2019 -3.6832% 150.677261 200.0610% 143.768646 -550205 138, 309998 -45.5619% 161.919418 63.2434 3,140.979980 48 40.8564% -1.9673% 3.230.780029 49 34.3079 50 Jan-2020 Feb-2020 Mar-2020 -19537% 161.653961 163.386826 12.0635 3,225.520000 147.514297 -1165763 2954.220000 130.297638 -140.05429 2304.590000 140.705292 117.650002 -1792495% 96.599998 214.7047% 108. 150002 1434783% 117.300003 Jun-2020 111.510002 51 52 Apr-2020 -100 9326 -150.1432% 958512 2.912.430000 53 May-2020 101.5257% 152.2129 140513474 54 3,044.310000 -99.2327% -1.6359 19.6599 54.33819 142.815536 55 Jul-2020 3,100 290000 116 940002 58 4342% 220661 128 235352 -122.50929 3,271.120000 56 Aug-2020 131869995 153.2067% 661216 134.197963 57 Sep-2020 124.080002 55.7971% 3,500 310000 -70.8879% 8407768 134 583923 58 Oct-2020 121.250000 34511 3.363.000000 27.3695% 153421463 59 Nov-2020 148009995 167.9625 2648412% 3269 960000 60 Dec-2020 168 884018 181. 179993 120.941 268 927% 171.137375 -33.19099 129.05-40% 44 5457 3621630000 3.756.070000 160112 Average return 15.50% Standard deviation of returns 1966 69.24% 52.82% BLAAL Start Ha 33 34 35 FREIL WILSO 98.505562 90.400734 -98.7334% -3.7572% -60.8824% -4.9540% 79.1893% 3.2393 % 18.3895% 1.0931% 42.7319 % -1.4631% -1.4813% -23.3108% 41.0094% 21.8409% 21.4612% 44.6378% -0.4670% 10.9095% 13.8915% 5.7765% 23.2186 9:54 AM Tue Jun 21 ExcelProject1.xlsx Start Here Project 1 Grading BILL Assame that you recently graduated and landed a job as a financial planner with Cicero Services, an investment advisory company. Your first client recently inherited some assets and has asked you to evaluate them. The client was a stock portfolio invested in The Walt Disney Company (DIS) and Automatic Data Processing, Inc. (ADP) You have observed monthly stock prices for S&P 500 (GSPC), The Walt Disney Company (DES), and Automatic Data Processing, Inc. (ADP) over the five-year period from December of 2015 to December of 2020. Calculate average monthly return (annualized) and the standard deviation of returns for S&P 500 (GSPC), The Walt Disney Company (DIS), and Automatic Data Processing, Inc. (ADP). Note: "For 60 monthly returns (five years worth of monthly returns) you will use 61 monthly prices. "Remember to annealize the monthly rate of return (simply multiply the calculated return by 12) "Assume that the risk-free rate is 3% and the market risk premium is 6% Ticker Name S&P 500 The Walt Disney Company Automatic Data Processing, Inc. 1.00% 6.00% 50% DES ADP GSPC S&P 500 The Walt Disney CompanyAmatic Data Processing, Inc. Price Observation Menth-Year Retens Price Reha Dec-2015 73.551994 98.505562 93400734 -8.7334 I Jan-2016 72.582512 -15.83715 Feb-2016 90.117691 73.980194 Mar-2016 93.693344 78.365372 Apr-2016 97419949 77.737923 May-2016 93.608437 77.210518 6 Jan-2016 92.287621 80.792831 78.666153 Jul-2016 90,523349 Aug-2016 89.765007 79.426689 Sep-2016 88244545 78.002846 10 Oct-2016 88.082993 77.451477 11 Nov-2016 94.193.398 85422585 12 Dec-2016 98039917 91-416501 13 Jan-2017 105.96067 90.18066 14 Feb-2017 105.424416 9183946 Mar-2017 108 554564 91633614 15 16 Ape-2017 11070090 94.027023 17 May-2017 103.365532 92.119306 IN Jan-2017 101 747147 92.200244 19 Jul-2017 105.271202 107.609192 20 Aug-2017 97612103 96.351448 21 Sep-2017 95094833 9593050 22 Oct-2017 94.361618 105.768997 23 Nov-2017 101 124481 104.131401 24 Dec-2017 103.719643 106.615082 Jan-2018 105.682121 113.088547 25 26 Feb-2018 100.323616 105.487114 103,804039 27 Mar-2018 97678906 97 571426 28 Apr-2018 108.605804 May-2018 96.735062 119.587807 Jan-2018 101.926236 123.377235 29 30 31 32 Aug-2015 109.815689 Jul-2018 110.437668 124.791710 135.663254 Sep-2018 114638885 139.27789) 133.822556 33 34 Oct-2018 112.570404 35 Nov-2018 113.217415 36 107.492332 136.924774 Dec-2013 121.785217 GSPC DIS ADP Inputs: Risk-free rate, F Market rik premio RPM %of The Walt Disney Company in Portfoli % of Automatic Data Processing, Inc. is Portfoli Price 2.043.919941 1.940 239990 1.932 229980 2.059.739990 2065300049 2.06.949991 2008.860107 2173600098 2.170.949951 2,168 270020 2.126149902 2,198.810059 2.258.830078 2.278.870117 2.363639893 2.362.719971 2.384.199951 2,411.800049 2423.409912 2470 300049 2.471649902 2519 360107 2.575.260010 2.584 540055 2.673.610107 2.823.810059 2713830078 2.640 X70117 2.645050049 2.705.270020 2.718 370117 2816 290039 2.901 520020 2,913,979960 2,7117199 2.760.169922 7.506.350098 30 points possible 100% : % 408874 The values in 123, F23 and 23 are correct. You ca 9:54 AM Tue Jun 21 Start Here Observation 1 ExcelProject1.xlsx Grading DIS ADF The Walt Disney Company Aomatic Data Processing, Inc. Price Month-Year Reten Price Re 98.505562 Dee-2015 Jan-2016 90.400754 48.7334% 73.351994 73.582512 73.990194 Feb-2016 90.117691 Mar-2016 93.693341 78.365377 Ape-2016 97.419945 77.737923 May-2016 93.608437 77.210536 Jun-2016 92.287621 80.752831 Jul-2016 90.523369 78.666153 Aug-2016 89.765007 79.426689 Sep-2016 88 244545 78.002846 19 Oct-2016 88082993 77451477 11 Nov-2016 94 191398 85.422585 91416501 12 Dec-2016 99039917 105960678 13 Jan-2017 90.18063 14 Feb-2017 105.424416 9183946 15 Mar-2017 108 554564 91633614 16 Apr-2017 110.700690 94.027023 17 May-2017 103.365532 92.119300 18 Jun-2017 101.747147 92-200294 19 Jul-2017 105.271202 107609192 20 Aug-2017 97.632103 96.351448 21 Sep-2017 95 094833 98.930550 22 Oct-2017 94361618 105.768997 23 Nov-2017 101.134481 104.131401 24 Dec-2017 103.719643 106.615042 25 Jan-2018 105.682121 113068547 26 Feb-2018 100 323616 105.487114 103.804019 Mar-2018 976784M 23 Apr-2018 97.571426 108605504 29 May-2018 96.735062 119.587807 30 Jun-2018 101 928238 123.377235 31 Jul-2018 110.437668 124.791710 32 Aug-2018 109.815689 135.663254 33 Sep-2018 114638885 139.277893 34 Oct-2018 112.570404 133.822556 35 Nov-2018 113 217415 136.924774 36 Dec-2018 107.492332 121.785217 37 Jan-2019 110.173538 130623779 Feb-2019 111477608 142944504 38 39 Mar-2019 107689461 149.212280 40 Apr-2019 135.316209 154.355270 150.345932 41 42 May-2019 13044578 Jun-2019 137954041 155.237869 43 Jul-2019 141 283356 157,106451 44 Aug-2019 136.442535 160238754 45 Sep-2019 129543869 Oct-2019 129.146255 Nov-2019 150677261 152.294769 153.813034 161.919418 47 48 Dec-2019 143.76664 49 Jan-2020 138 309998 Feb-2020 117.650002 96.59999 Ape-2020 108.150002 51 Mar-2020 52 53 May-2020 11730000 34 Jun-2020 111510002 55 56 Jul-2020 116.940002 131 86995 Aug-2020 Sep-2020 124.080002 57 58 Oct-2020 121 250000 Nov-2020 145.009995 59 60 Dec-2020 181.179993 Average return Standard devation of 2 3 4 5 9 R 9 LE SP Project 1 196659191 163.386826 147.514297 130.297638 140.305292 140513474 142 815536 128215352 134.197983 134.583933 153421463 168.5841 171.837379 PGSPC S&P 500 Price 2,043 939941 158171 1940.239990 1932 229980 2,059.739990 2,065 300049 2,0699951 2,098 86007 2,173.600098 2.10949951 2,168 270020 2,126 149902 2,398 810059 2,238 830078 2,278 870117 2.363.639893 2.362 719971 7,384.199951 2411 800049 2,423 409912 2,470 300049 2,471 649902 2.319 360107 2,575.260010 2,58484008 2673.610107 2823.810059 2713830078 2,640870117 2.648 050049 2,705.270000 2,718 370117 2.316.290019 2.901 520020 2.913979980 2.711 739990 2,760 169922 2.500 850098 2,704, 10000 2,784 489990 2834399902 2945830078 2,752060059 2,941.760010 2.980.379583 2,926 459961 2,976 799990 3,037.560059 3,140 979980 3,230 780029 3,225.520000 2,954 220000 2,384 990000 2912.430000 3,044 310000 3,100290000 3,271 120000 3,500 310000 3,363.000000 3,209 960000 3621630000 3.756 070000 100% *** Returns 40.5824% The values in D23 F25 and 123 are correct. You ca A rol Dre Yerd (ADP) the The AN, II 13 ape 16 p D-43B4- manne, repergured a vene GALL plezal van kyan L y The Way period of averago mwadily return (and) and the (0) of y LIIK Sen THE hining in 1 wag mong may pa AMALANG Sat M Q y grand landed a job A option whe www. N SHE 2 FINES W They Company otomat AA 201 3 E S D X afmonial planner with fres, comp th Ping y Company (1) and (XP) Processing be P100(CPC). The x command 1 4 C (3 R F N 5 V www.c 44 T G > 6 Lini ime MacBook Pro 4 Y MARC B 7 H n N a 8 J nie te Some Conta) 1 M 1 9 K 2,043.939941 PRYLLYBEASOOM 73.551994 Dec-2015 72.582512 -15.8171% 1,940.239990 1 Jan-2016 73.980194 2 Feb-2016 90.117691 3 Mar-2016 93.693344 4 Apr-2016 97.419945 5 May-2016 23.10779 1,932 229980 47,6131% 78.365372 71.1300% 2,059.739990 -9.6081% 2,065.300049 47.7293% 77.737923 77.210518 -81413% 2,096.949951 93.608437 92.287621 -46.9494% -169320% 80.752831 55.0544% 2,098.860107 6 Jun-2016 -31.0084% 2,173.600098 78.666153 -22.9403% 90.523369 7 Jul-2016 79,426689 -10.0530% 8 89.765007 Aug-2016 11.6015% 2.170 949951 -21.511896 2,168 270020 -20.3299% 78.002846 88.244545 9 Sep-2016 Oct-2016 77.451477 88.082993 -2.1969% 10 11 Nov-2016 85.422585 94.193398 83.2452% 61.7434% 12 99.039917 91.436501 Dec-2016 90.380676 83.8542% 13 Jan-2017 105.960678 91,839462 14 Feb-2017 15 Mar-2017 16 Apr-2017 17 18 -8.482396 2,126149902 123.500998 2,198.810059 84.48239 2,238 830078 -13.8565% 2,278.870117 19.36869 2,363.639993 91.633614 -2.6897% 2,362719971 94.027023 31.3432% 2,384.199951 92.119308 -24 3468% 2,411.800049 92.200294 1.0550 % 2,423.409912 107.609192 200.5490% 2,470.300049) 96.351448-125.540396 2471.649902 98930580 321216% 2,519.360107 -9.2524% 105.768997 82.9481% 2,575.260010 86.0036% 104.131401 -185793% 2,584.840088 30.7957% 106.615082 19 0.6557% 20 Aug-2017 23,1636% 21 105.424416 -6.0731% 108.584564 35.970696 110,700890 23.3881% May-2017 103.365532 -79.5154% Jun-2017 101.747147 -18.788396 Jul-2017 105.271202 41.5625% 97.632103 -87.0791% Sep-2017 95.094833 -31.1857% 22 Oct-2017 94.361618 23 Nov-2017 101.124481 24 Dec-2017 103.719643 25 Jan-2018 105.682121 Feb-2018 100.323616 -60 8448% Mar-2018 97.678406 -31.6401% 28 Apr-2018 97.571426 -1.3143 % May-2018 96.735062 -10 2862% 101.928238 64.4214% 110.437668 100 1814% 26.6258% 4.4641% 41.2111% 67.4144% 26 -46.7368% 22.7052% 113.088547 105.487114 103.804039 108.605804 28.6217% 2.673.610107 72.8517% 2,823.810059 -80.6600 % 2,713 830078 -19.1463% 2,640.870117 55.50969 2,648.050049 119.587807 121.3416 27 -32.2614% 3.2625% 29 2,705.270020 25.9300% 30 Jun-2018 3802499 2,718.370117 5.8109% 137576% 2,816.290039 43.22599 31 123.377235 124.791710 135.663254 Jul-2018 Aug-2018 109.815689 32 -6.7583% 104.5410% 2,901.520020 36.3159% Sep-2018 114.638885 52.7050% 5.1531% 112 570404 -21.6521% -83.2840% Oct-2018 Nov-2018 113.217415 Dec-2018 21.4312% 36 -1101323% 37 94.42139 38 35.6747% 39 139.277893 31.9730% 2,913.979980 133.822556 47.0025% 2,711.739990 6.8971% 136.924774 27.8179% 2,760 169922 107.492332 60.6806% 121.785217 -132.6821% 2.506.850098 Jan-2019 110.173538 29.9319% 130.623779 87.09009 2,704.100099 Feb-2019 111.477608 14.2038% 142944504 113.1867% 2,784 489990 Mar-2019 109 609461 -19,2485% 149 212280 Apr-2019 135.316269 280.3566% 154.355270 41 May-2019 130.445786 -43.1920% 150.345932 42 Jun-2019 137.954041 6907019 155.237869 43 Jul-2019 141.283356 28-9602% 157.106461 Aug-2019 136 442535) -41.1150% 160.238754 45 Sep-2019 129.543869 -60.6732% 152.294769 46 Oct-2019 21.5091% 40 47.1762% 52.617198 2834399902) 41.3611% 2,945 830078 -31.1697 2.752.060059 39.0454 2,941.760010 -78.9333% 82.7162% 14.4444 2.980.379883 15.7539% 44 23.92499 2,926.459961 -21.7100% 59.49119 2976.739990 20.6174% 129.146255 153.813034 11.96319 3,037.560059 24.5181% 47 Nov-2019 Dec-2019 -3.6832% 150.677261 200.0610% 143.768646 -550205 138, 309998 -45.5619% 161.919418 63.2434 3,140.979980 48 40.8564% -1.9673% 3.230.780029 49 34.3079 50 Jan-2020 Feb-2020 Mar-2020 -19537% 161.653961 163.386826 12.0635 3,225.520000 147.514297 -1165763 2954.220000 130.297638 -140.05429 2304.590000 140.705292 117.650002 -1792495% 96.599998 214.7047% 108. 150002 1434783% 117.300003 Jun-2020 111.510002 51 52 Apr-2020 -100 9326 -150.1432% 958512 2.912.430000 53 May-2020 101.5257% 152.2129 140513474 54 3,044.310000 -99.2327% -1.6359 19.6599 54.33819 142.815536 55 Jul-2020 3,100 290000 116 940002 58 4342% 220661 128 235352 -122.50929 3,271.120000 56 Aug-2020 131869995 153.2067% 661216 134.197963 57 Sep-2020 124.080002 55.7971% 3,500 310000 -70.8879% 8407768 134 583923 58 Oct-2020 121.250000 34511 3.363.000000 27.3695% 153421463 59 Nov-2020 148009995 167.9625 2648412% 3269 960000 60 Dec-2020 168 884018 181. 179993 120.941 268 927% 171.137375 -33.19099 129.05-40% 44 5457 3621630000 3.756.070000 160112 Average return 15.50% Standard deviation of returns 1966 69.24% 52.82% BLAAL Start Ha 33 34 35 FREIL WILSO 98.505562 90.400734 -98.7334% -3.7572% -60.8824% -4.9540% 79.1893% 3.2393 % 18.3895% 1.0931% 42.7319 % -1.4631% -1.4813% -23.3108% 41.0094% 21.8409% 21.4612% 44.6378% -0.4670% 10.9095% 13.8915% 5.7765% 23.2186 9:54 AM Tue Jun 21 ExcelProject1.xlsx Start Here Project 1 Grading BILL Assame that you recently graduated and landed a job as a financial planner with Cicero Services, an investment advisory company. Your first client recently inherited some assets and has asked you to evaluate them. The client was a stock portfolio invested in The Walt Disney Company (DIS) and Automatic Data Processing, Inc. (ADP) You have observed monthly stock prices for S&P 500 (GSPC), The Walt Disney Company (DES), and Automatic Data Processing, Inc. (ADP) over the five-year period from December of 2015 to December of 2020. Calculate average monthly return (annualized) and the standard deviation of returns for S&P 500 (GSPC), The Walt Disney Company (DIS), and Automatic Data Processing, Inc. (ADP). Note: "For 60 monthly returns (five years worth of monthly returns) you will use 61 monthly prices. "Remember to annealize the monthly rate of return (simply multiply the calculated return by 12) "Assume that the risk-free rate is 3% and the market risk premium is 6% Ticker Name S&P 500 The Walt Disney Company Automatic Data Processing, Inc. 1.00% 6.00% 50% DES ADP GSPC S&P 500 The Walt Disney CompanyAmatic Data Processing, Inc. Price Observation Menth-Year Retens Price Reha Dec-2015 73.551994 98.505562 93400734 -8.7334 I Jan-2016 72.582512 -15.83715 Feb-2016 90.117691 73.980194 Mar-2016 93.693344 78.365372 Apr-2016 97419949 77.737923 May-2016 93.608437 77.210518 6 Jan-2016 92.287621 80.792831 78.666153 Jul-2016 90,523349 Aug-2016 89.765007 79.426689 Sep-2016 88244545 78.002846 10 Oct-2016 88.082993 77.451477 11 Nov-2016 94.193.398 85422585 12 Dec-2016 98039917 91-416501 13 Jan-2017 105.96067 90.18066 14 Feb-2017 105.424416 9183946 Mar-2017 108 554564 91633614 15 16 Ape-2017 11070090 94.027023 17 May-2017 103.365532 92.119306 IN Jan-2017 101 747147 92.200244 19 Jul-2017 105.271202 107.609192 20 Aug-2017 97612103 96.351448 21 Sep-2017 95094833 9593050 22 Oct-2017 94.361618 105.768997 23 Nov-2017 101 124481 104.131401 24 Dec-2017 103.719643 106.615082 Jan-2018 105.682121 113.088547 25 26 Feb-2018 100.323616 105.487114 103,804039 27 Mar-2018 97678906 97 571426 28 Apr-2018 108.605804 May-2018 96.735062 119.587807 Jan-2018 101.926236 123.377235 29 30 31 32 Aug-2015 109.815689 Jul-2018 110.437668 124.791710 135.663254 Sep-2018 114638885 139.27789) 133.822556 33 34 Oct-2018 112.570404 35 Nov-2018 113.217415 36 107.492332 136.924774 Dec-2013 121.785217 GSPC DIS ADP Inputs: Risk-free rate, F Market rik premio RPM %of The Walt Disney Company in Portfoli % of Automatic Data Processing, Inc. is Portfoli Price 2.043.919941 1.940 239990 1.932 229980 2.059.739990 2065300049 2.06.949991 2008.860107 2173600098 2.170.949951 2,168 270020 2.126149902 2,198.810059 2.258.830078 2.278.870117 2.363639893 2.362.719971 2.384.199951 2,411.800049 2423.409912 2470 300049 2.471649902 2519 360107 2.575.260010 2.584 540055 2.673.610107 2.823.810059 2713830078 2.640 X70117 2.645050049 2.705.270020 2.718 370117 2816 290039 2.901 520020 2,913,979960 2,7117199 2.760.169922 7.506.350098 30 points possible 100% : % 408874 The values in 123, F23 and 23 are correct. You ca 9:54 AM Tue Jun 21 Start Here Observation 1 ExcelProject1.xlsx Grading DIS ADF The Walt Disney Company Aomatic Data Processing, Inc. Price Month-Year Reten Price Re 98.505562 Dee-2015 Jan-2016 90.400754 48.7334% 73.351994 73.582512 73.990194 Feb-2016 90.117691 Mar-2016 93.693341 78.365377 Ape-2016 97.419945 77.737923 May-2016 93.608437 77.210536 Jun-2016 92.287621 80.752831 Jul-2016 90.523369 78.666153 Aug-2016 89.765007 79.426689 Sep-2016 88 244545 78.002846 19 Oct-2016 88082993 77451477 11 Nov-2016 94 191398 85.422585 91416501 12 Dec-2016 99039917 105960678 13 Jan-2017 90.18063 14 Feb-2017 105.424416 9183946 15 Mar-2017 108 554564 91633614 16 Apr-2017 110.700690 94.027023 17 May-2017 103.365532 92.119300 18 Jun-2017 101.747147 92-200294 19 Jul-2017 105.271202 107609192 20 Aug-2017 97.632103 96.351448 21 Sep-2017 95 094833 98.930550 22 Oct-2017 94361618 105.768997 23 Nov-2017 101.134481 104.131401 24 Dec-2017 103.719643 106.615042 25 Jan-2018 105.682121 113068547 26 Feb-2018 100 323616 105.487114 103.804019 Mar-2018 976784M 23 Apr-2018 97.571426 108605504 29 May-2018 96.735062 119.587807 30 Jun-2018 101 928238 123.377235 31 Jul-2018 110.437668 124.791710 32 Aug-2018 109.815689 135.663254 33 Sep-2018 114638885 139.277893 34 Oct-2018 112.570404 133.822556 35 Nov-2018 113 217415 136.924774 36 Dec-2018 107.492332 121.785217 37 Jan-2019 110.173538 130623779 Feb-2019 111477608 142944504 38 39 Mar-2019 107689461 149.212280 40 Apr-2019 135.316209 154.355270 150.345932 41 42 May-2019 13044578 Jun-2019 137954041 155.237869 43 Jul-2019 141 283356 157,106451 44 Aug-2019 136.442535 160238754 45 Sep-2019 129543869 Oct-2019 129.146255 Nov-2019 150677261 152.294769 153.813034 161.919418 47 48 Dec-2019 143.76664 49 Jan-2020 138 309998 Feb-2020 117.650002 96.59999 Ape-2020 108.150002 51 Mar-2020 52 53 May-2020 11730000 34 Jun-2020 111510002 55 56 Jul-2020 116.940002 131 86995 Aug-2020 Sep-2020 124.080002 57 58 Oct-2020 121 250000 Nov-2020 145.009995 59 60 Dec-2020 181.179993 Average return Standard devation of 2 3 4 5 9 R 9 LE SP Project 1 196659191 163.386826 147.514297 130.297638 140.305292 140513474 142 815536 128215352 134.197983 134.583933 153421463 168.5841 171.837379 PGSPC S&P 500 Price 2,043 939941 158171 1940.239990 1932 229980 2,059.739990 2,065 300049 2,0699951 2,098 86007 2,173.600098 2.10949951 2,168 270020 2,126 149902 2,398 810059 2,238 830078 2,278 870117 2.363.639893 2.362 719971 7,384.199951 2411 800049 2,423 409912 2,470 300049 2,471 649902 2.319 360107 2,575.260010 2,58484008 2673.610107 2823.810059 2713830078 2,640870117 2.648 050049 2,705.270000 2,718 370117 2.316.290019 2.901 520020 2.913979980 2.711 739990 2,760 169922 2.500 850098 2,704, 10000 2,784 489990 2834399902 2945830078 2,752060059 2,941.760010 2.980.379583 2,926 459961 2,976 799990 3,037.560059 3,140 979980 3,230 780029 3,225.520000 2,954 220000 2,384 990000 2912.430000 3,044 310000 3,100290000 3,271 120000 3,500 310000 3,363.000000 3,209 960000 3621630000 3.756 070000 100% *** Returns 40.5824% The values in D23 F25 and 123 are correct. You ca
Step by Step Solution
There are 3 Steps involved in it

Get step-by-step solutions from verified subject matter experts