

Question: Need Times Interest Earned Ratio, operating profit margin, return to total asset & price earnings ratio. Please explain as well. Dec. 31, 2020 Dec. 31,
Need Times Interest Earned Ratio, operating profit margin, return to total asset & price earnings ratio. Please explain as well.
| Dec. 31, 2020 | Dec. 31, 2019 | |
| CURRENT ASSETS | ||
| Cash and cash equivalents | $ 607,987 | $ 480,626 |
| Accounts receivable, net | 104,500 | 80,545 |
| Inventory | 26,445 | 26,096 |
| Prepaid expenses and other current assets | 54,906 | 57,076 |
| Income tax receivable | 282,783 | 27,705 |
| Investments | 343,616 | 400,156 |
| Total current assets | 1,420,237 | 1,072,204 |
| Leasehold improvements, property and equipment, net | 1,584,311 | 1,458,690 |
| Long term investments | 102,328 | 0 |
| Restricted cash | 27,849 | 27,855 |
| Operating lease assets | 2,767,185 | 2,505,466 |
| Other assets | 59,047 | 18,450 |
| Goodwill | 21,939 | 21,939 |
| Total assets | 5,982,896 | 5,104,604 |
| Current liabilities: | ||
| Accounts payable | 121,990 | 115,816 |
| Accrued payroll and benefits | 203,054 | 126,600 |
| Accrued liabilities | 164,649 | 155,843 |
| Unearned revenue | 127,750 | 95,195 |
| Current operating lease liabilities | 204,756 | 173,139 |
| Total current liabilities | 822,199 | 666,593 |
| Commitments and contingencies (Note 12) | ||
| Long-term operating lease liabilities | 2,678,374 | |
| Deferred income tax liabilities | 149,422 | 37,814 |
| Other liabilities | 38,844 | 38,797 |
| Total liabilities | 3,962,761 | 3,421,578 |
| Shareholders' equity: | ||
| Preferred stock, $0.01 par value, 600,000 shares authorized, no shares issued as of December 31, 2020 and 2019, respectively | 0 | 0 |
| Common stock, $0.01 par value, 230,000 shares authorized, 36,704 and 36,323 shares issued as of December 31, 2020 and 2019, respectively | 367 | 363 |
| Additional paid-in capital | 1,549,909 | 1,465,697 |
| Treasury stock, at cost, 8,703 and 8,568 common shares as of December 31, 2020 and 2019, respectively | (2,802,075) | (2,699,119) |
| Accumulated other comprehensive loss | (4,229) | (5,363) |
| Retained earnings | 3,276,163 | 2,921,448 |
| Total shareholders' equity | 2,020,135 | 1,683,026 |
| Total liabilities and shareholders' equity | $ 5,982,896 | $ 5,104,604 |
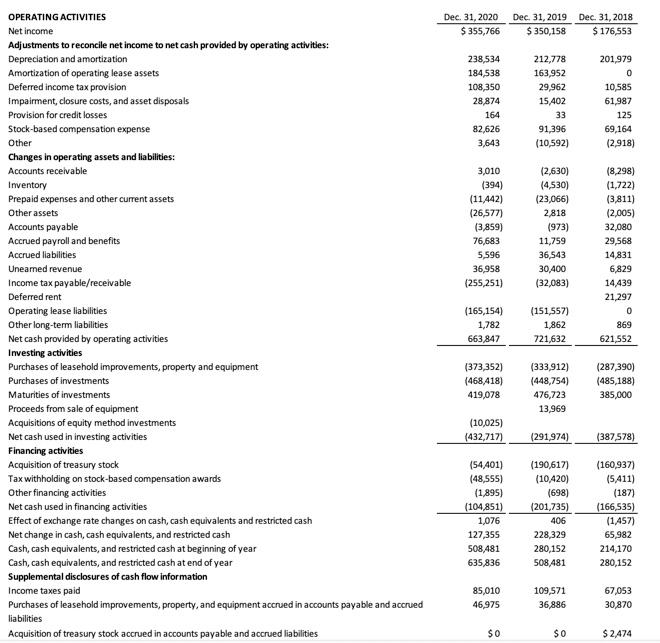
Dec 31, 2020 $ 355,766 Dec 31, 2019 Dec 31, 2018 $ 350,158 $ 176,553 238,534 184,538 108,350 28,874 164 82,626 3,643 212,778 163,952 29,962 15,402 33 91 396 (10,592) 201,979 0 10,585 61,987 125 69,164 (2.918) 3,010 (394) (11442) (26,577) (3,859) 76,683 5,596 36,958 (255,251) (2,630) (4,530) (23,066) 2818 (973) 11,759 36,543 30,400 (32,083) OPERATING ACTIVITIES Net income Adjustments to reconcile net income to net cash provided by operating activities: Depreciation and amortization Amortization of operating lease assets Deferred income tax provision impaiment, closure costs, and asset disposals Provision for credit losses Stock-based compensation expense Other Changes in operating assets and liabilities: Accounts receivable Inventory Prepaid expenses and other current assets Other assets Accounts payable Accrued payroll and benefits Accrued liabilities Uneamed revenue Income tax payable/receivable Deferred rent Operating lease liabilities Other long-term liabilities Net cash provided by operating activities Investing activities Purchases of leasehold improvements, property and equipment Purchases of investments Maturities of investments Proceeds from sale of equipment Acquisitions of equity method investments Net cash used in investing activities Financing activities Acquisition of treasury stock Tax withholding on stock-based compensation awards Other financing activities Net cash used in financing activities Effect of exchange rate changes on cash, cash equivalents and restricted cash Net change in cash, cash equivalents, and restricted cash Cash, cash equivalents, and restricted cash at beginning of year Cash, cash equivalents, and restricted cash at end of year Supplemental disclosures of cash flow information Income taxes paid Purchases of leasehold improvements, property, and equipment accrued in accounts payable and accrued liabilities Acquisition of treasury stock accrued in accounts payable and accrued liabilities (8,298) (1,722) (3,811) (2,005) 32,080 29,568 14,831 6,829 14,439 21,297 0 869 621,552 (165,154) 1,782 663,847 (151,557) 1,862 721,632 (373,352) (468,418) 419,078 (333,912) (448,754) 476,723 13,969 (287,390) (485,188) 385,000 (10,025) (432,717) (291,974) (387,578) (54401) (48,555) (1895) (104,851) 1,076 127,355 508,481 635,836 (190,617) (10,420) (698) (201,735) 406 228,329 280,152 508,481 (160,937) (5,411) (187) (166,535) (1,457) 65,982 214,170 280,152 85,010 46,975 109,571 36,886 67,053 30,870 $0 SO $ 2,474 Dec 31, 2020 $ 355,766 Dec 31, 2019 Dec 31, 2018 $ 350,158 $ 176,553 238,534 184,538 108,350 28,874 164 82,626 3,643 212,778 163,952 29,962 15,402 33 91 396 (10,592) 201,979 0 10,585 61,987 125 69,164 (2.918) 3,010 (394) (11442) (26,577) (3,859) 76,683 5,596 36,958 (255,251) (2,630) (4,530) (23,066) 2818 (973) 11,759 36,543 30,400 (32,083) OPERATING ACTIVITIES Net income Adjustments to reconcile net income to net cash provided by operating activities: Depreciation and amortization Amortization of operating lease assets Deferred income tax provision impaiment, closure costs, and asset disposals Provision for credit losses Stock-based compensation expense Other Changes in operating assets and liabilities: Accounts receivable Inventory Prepaid expenses and other current assets Other assets Accounts payable Accrued payroll and benefits Accrued liabilities Uneamed revenue Income tax payable/receivable Deferred rent Operating lease liabilities Other long-term liabilities Net cash provided by operating activities Investing activities Purchases of leasehold improvements, property and equipment Purchases of investments Maturities of investments Proceeds from sale of equipment Acquisitions of equity method investments Net cash used in investing activities Financing activities Acquisition of treasury stock Tax withholding on stock-based compensation awards Other financing activities Net cash used in financing activities Effect of exchange rate changes on cash, cash equivalents and restricted cash Net change in cash, cash equivalents, and restricted cash Cash, cash equivalents, and restricted cash at beginning of year Cash, cash equivalents, and restricted cash at end of year Supplemental disclosures of cash flow information Income taxes paid Purchases of leasehold improvements, property, and equipment accrued in accounts payable and accrued liabilities Acquisition of treasury stock accrued in accounts payable and accrued liabilities (8,298) (1,722) (3,811) (2,005) 32,080 29,568 14,831 6,829 14,439 21,297 0 869 621,552 (165,154) 1,782 663,847 (151,557) 1,862 721,632 (373,352) (468,418) 419,078 (333,912) (448,754) 476,723 13,969 (287,390) (485,188) 385,000 (10,025) (432,717) (291,974) (387,578) (54401) (48,555) (1895) (104,851) 1,076 127,355 508,481 635,836 (190,617) (10,420) (698) (201,735) 406 228,329 280,152 508,481 (160,937) (5,411) (187) (166,535) (1,457) 65,982 214,170 280,152 85,010 46,975 109,571 36,886 67,053 30,870 $0 SO $ 2,474
Step by Step Solution
There are 3 Steps involved in it

Get step-by-step solutions from verified subject matter experts