

Question: NEED TO BE SOLVED ONLY BY USING EXCEL. SHARE THE EXCEL SHEET WITH FORMULAS. DONT POST HALF OR WRONG ANSWER. Weekly demand figures at Hot
NEED TO BE SOLVED ONLY BY USING EXCEL. SHARE THE EXCEL SHEET WITH FORMULAS. DONT POST HALF OR WRONG ANSWER.
Weekly demand figures at Hot Pizza are as shown. Estimate demand for the next 4 weeks using a 4-week moving average as well as simple exponential smoothing with =0.1. Evaluate the MAD, MAPE, MSE, bias, and TS in each case. Which of the two methods do you prefer? Why?
Compare the performance of simple exponential smoothing with =0.1 and =0.9. What difference in forecasts do you observe?
Which of the two smoothing constants do you prefer?
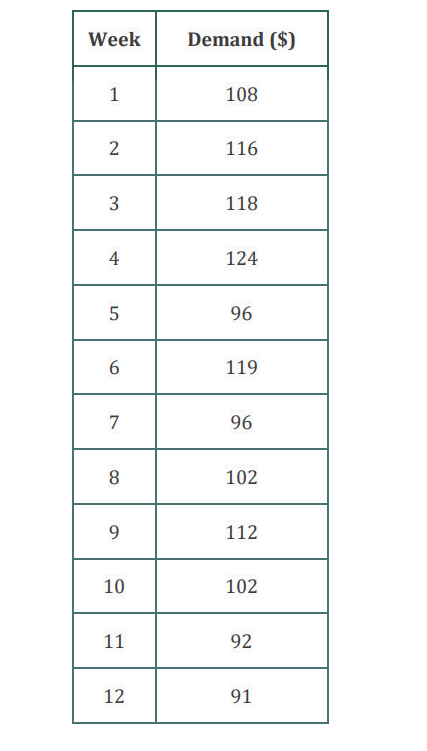
Week Demand ($) 1 108 N 116 3 118 4 124 5 96 6 119 7 96 8 102 9 112 10 102 11 92 12 91
Step by Step Solution
There are 3 Steps involved in it

Get step-by-step solutions from verified subject matter experts