

Question: need to do by using python spyder In the on-line resources3 you will find a file called sunspots.txt, which contains the observed number of sunspots
 need to do by using python spyder
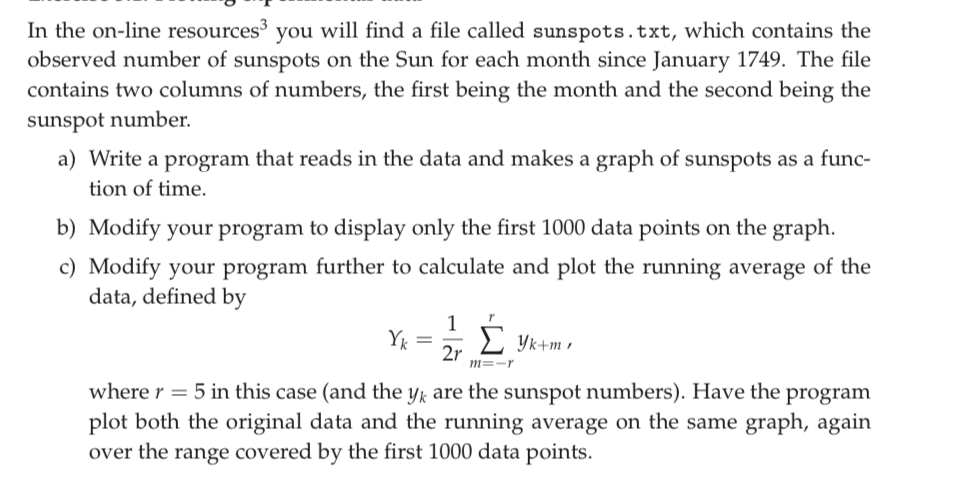
In the on-line resources3 you will find a file called sunspots.txt, which contains the observed number of sunspots on the Sun for each month since January 1749. The file contains two columns of numbers, the first being the month and the second being the sunspot number data and makes a graph of sunspots as a func- tion of time. b) Modify your program to display only the first 1000 data points on the graph c) Modify your program further to calculate and plot the running average of the data, defined by k+m m=-r where r = 5 in this case (and the yk are the sunspot numbers). Have the program plot both the original data and the running average on the same graph, again over the range covered by the first 1000 data points. In the on-line resources3 you will find a file called sunspots.txt, which contains the observed number of sunspots on the Sun for each month since January 1749. The file contains two columns of numbers, the first being the month and the second being the sunspot number data and makes a graph of sunspots as a func- tion of time. b) Modify your program to display only the first 1000 data points on the graph c) Modify your program further to calculate and plot the running average of the data, defined by k+m m=-r where r = 5 in this case (and the yk are the sunspot numbers). Have the program plot both the original data and the running average on the same graph, again over the range covered by the first 1000 data points
Step by Step Solution
There are 3 Steps involved in it

Get step-by-step solutions from verified subject matter experts