

Question: NEED TO KNOW HOW TO DO THIS IN EXCEL. THIS IS ALL ONE QUESTION. THANK YOU!! 10. Read the following Excel regression output and answer
NEED TO KNOW HOW TO DO THIS IN EXCEL. THIS IS ALL ONE QUESTION. THANK YOU!!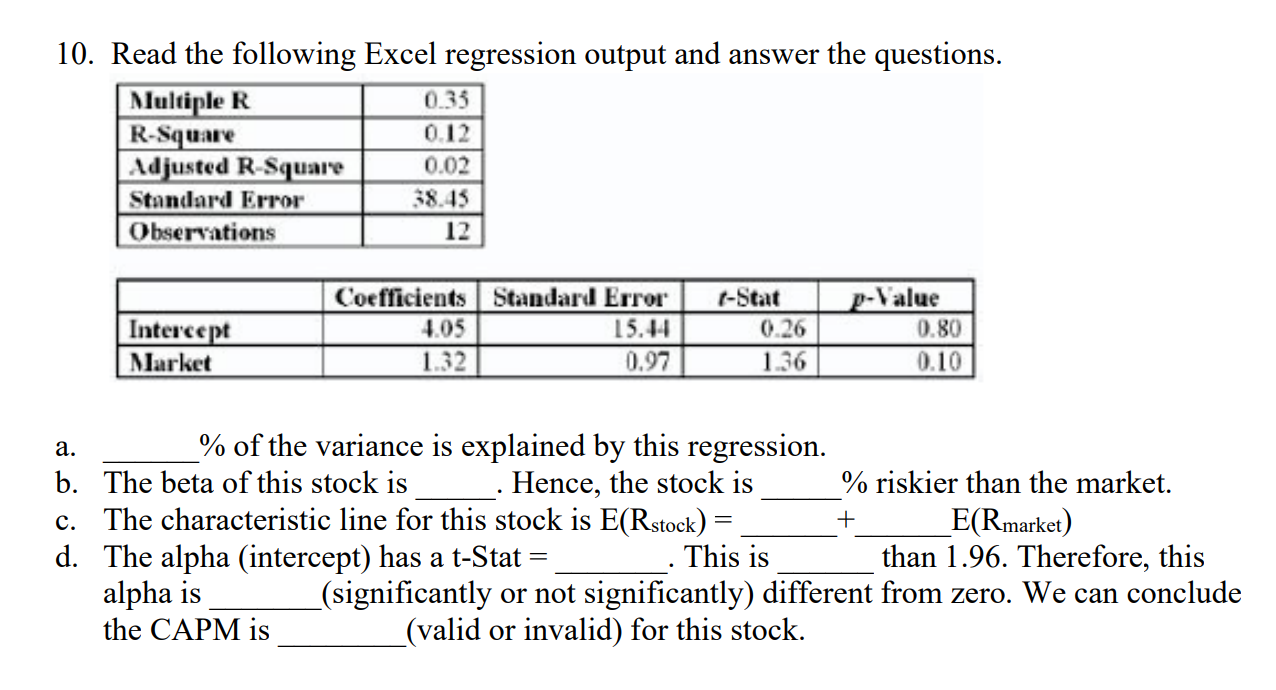
10. Read the following Excel regression output and answer the questions. Multiple R 0.35 R-Square 0.12 Adjusted R-Square 0.02 Standard Error 38.13 Observations 12 Intercept Market Coefficients Standard Error 4.05 15.44 1.32 0.97 1-Stat 0.26 1.36 p-value 0.80 0.10 + a. % of the variance is explained by this regression. b. The beta of this stock is Hence, the stock is % riskier than the market. c. The characteristic line for this stock is E(Rstock) = E(Rmarket) d. The alpha (intercept) has a t-Stat This is than 1.96. Therefore, this alpha is (significantly or not significantly) different from zero. We can conclude the CAPM is (valid or invalid) for this stock. 10. Read the following Excel regression output and answer the questions. Multiple R 0.35 R-Square 0.12 Adjusted R-Square 0.02 Standard Error 38.13 Observations 12 Intercept Market Coefficients Standard Error 4.05 15.44 1.32 0.97 1-Stat 0.26 1.36 p-value 0.80 0.10 + a. % of the variance is explained by this regression. b. The beta of this stock is Hence, the stock is % riskier than the market. c. The characteristic line for this stock is E(Rstock) = E(Rmarket) d. The alpha (intercept) has a t-Stat This is than 1.96. Therefore, this alpha is (significantly or not significantly) different from zero. We can conclude the CAPM is (valid or invalid) for this stock
Step by Step Solution
There are 3 Steps involved in it

Get step-by-step solutions from verified subject matter experts