

Question: Need to statistic project on excel sheet , its 4 question detail will be apply after , that i could attach file to you .
Need to statistic project on excel sheet , its 4 question
detail will be apply after , that i could attach file to you .
Looking at the correlation matrix identify one good and one bad regression pair and conduct detailed regression analysis with all explanations as in the slides.
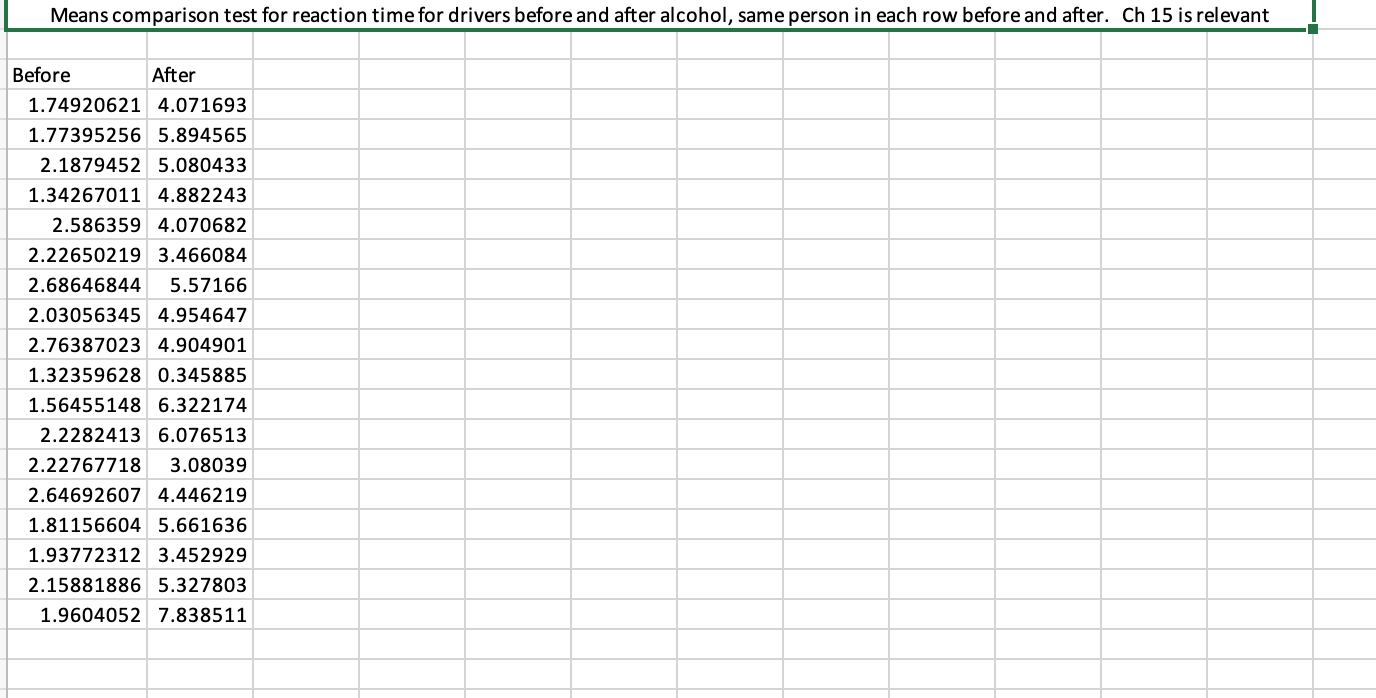
Means comparison test for reaction time for drivers before and after alcohol, same person in each row before and after.
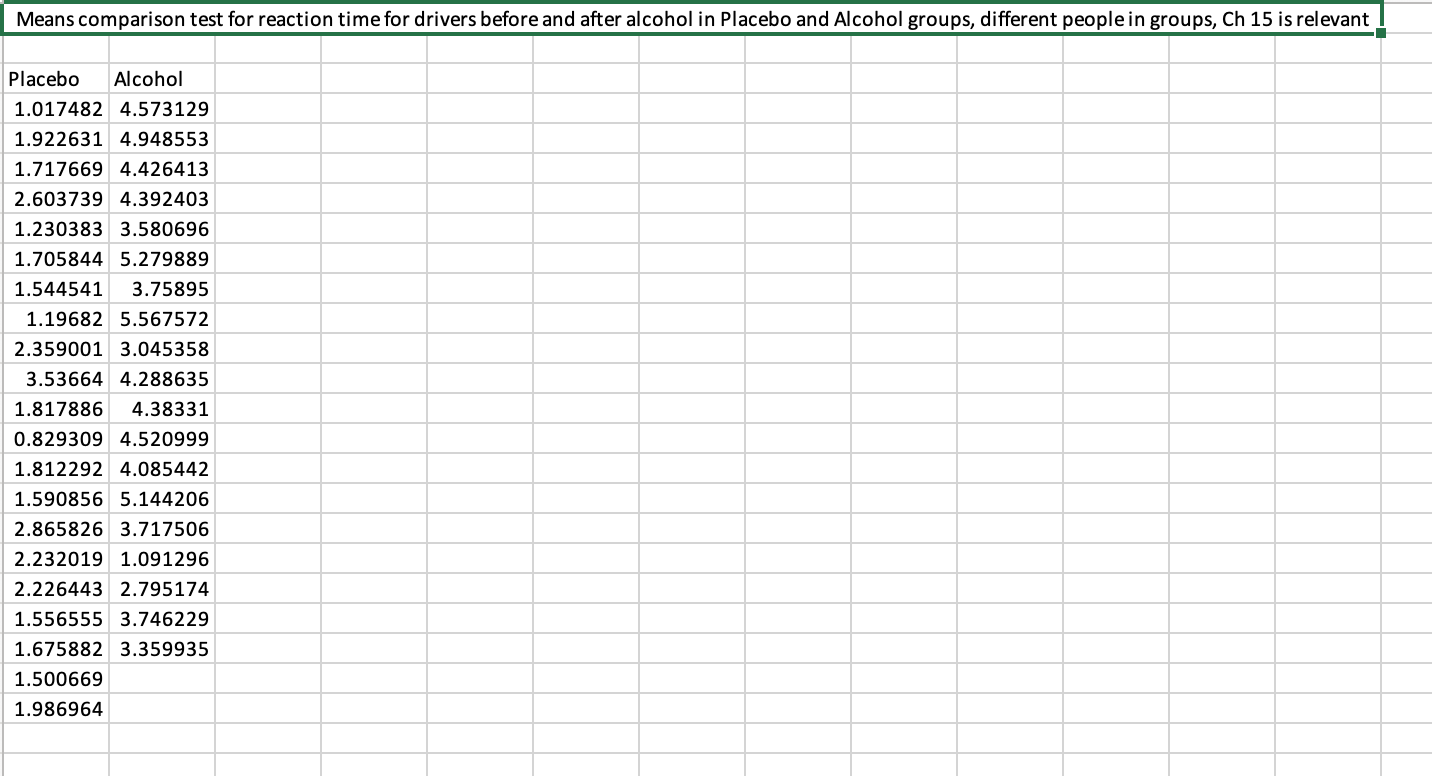
Means comparison test for reaction time for drivers before and after alcohol in Placebo and Alcohol groups, different people in groups,
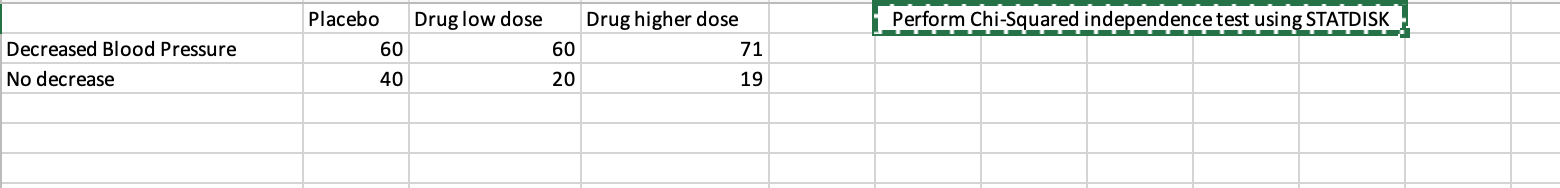
Perform Chi-Squared independence test using STATDISK
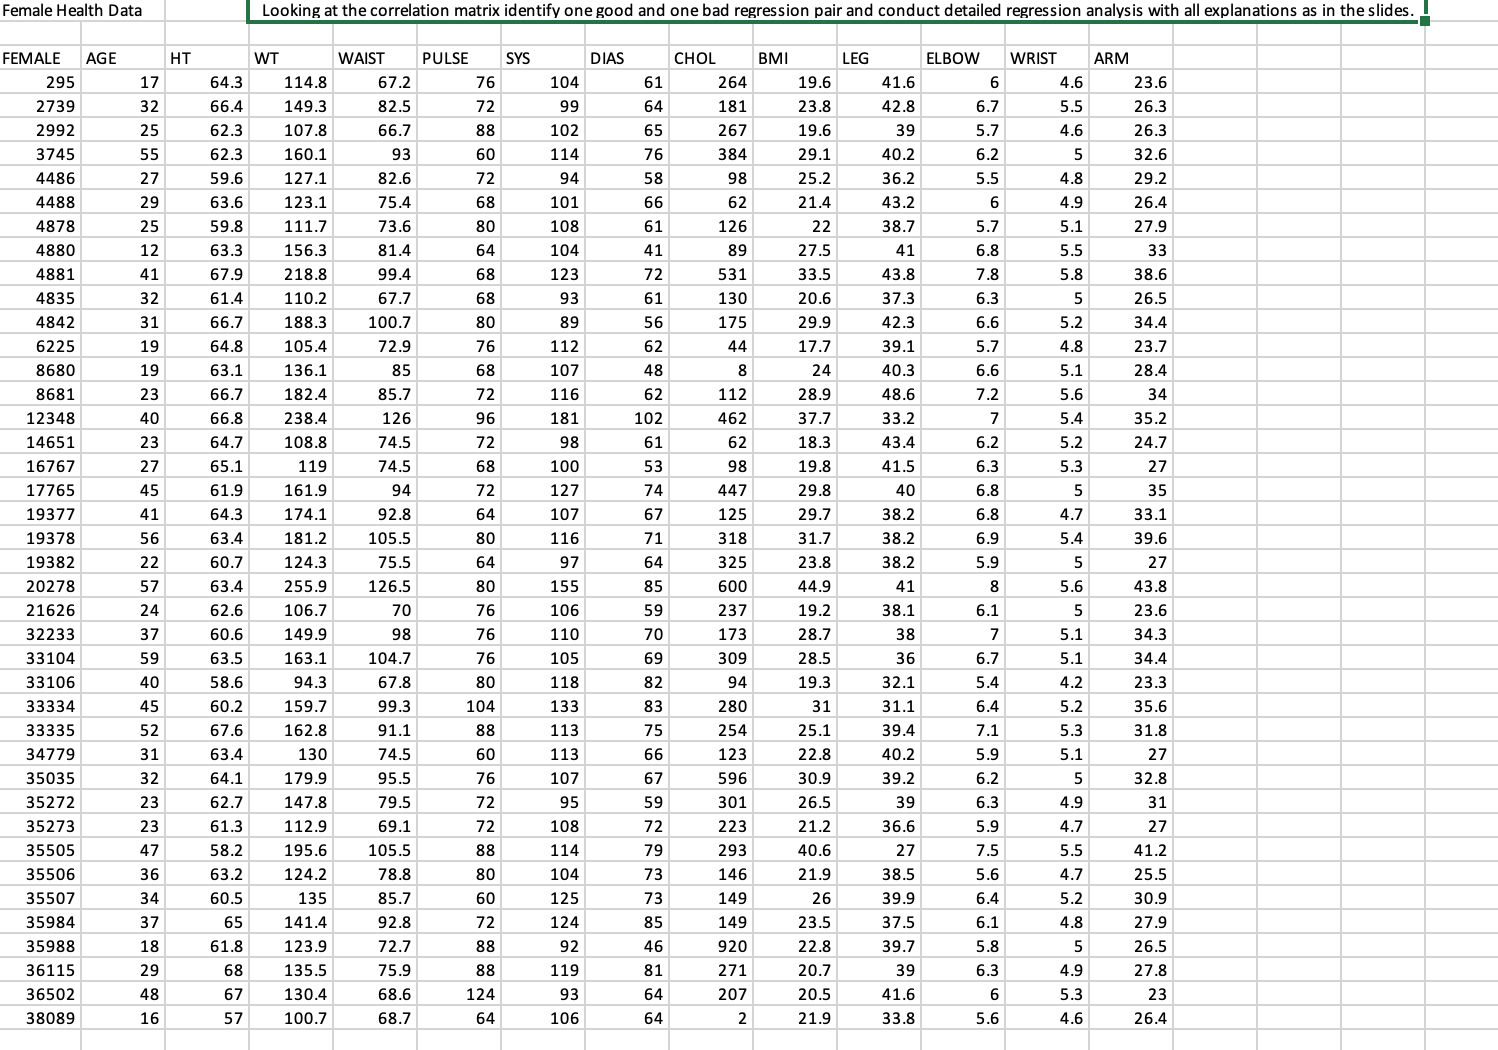
Female Health Data Looking at the correlation matrix identify one good and one bad regression pair and conduct detailed regression analysis with all explanations as in the slides. ! FEMALE AGE HT WT PULSE SYS CHOL BMI LEG ELBOW ARM 295 17 64.3 57.2 264 19.6 41.6 23.6 2739 32 66.4 82.5 64 181 42.8 5.5 26.3 88 26.3 55 62.3 60 114 76 384 29.1 40.2 59.6 82.6 58 98 25.2 36.2 29.2 29 63.6 123.1 75.4 68 101 66 43.2 26.4 4878 25 59.8 111.7 73.6 80 108 126 5.1 27.9 63.3 81.4 104 27.5 67.9 218.8 68 123 531 33.5 38.6 4835 61.4 110.2 67.7 68 93 130 20.6 37.3 26.5 31 66.7 80 56 175 42.3 34.4 6225 19 64.8 105.4 72.9 112 17.7 39.1 5.7 4.8 23.7 19 63.1 68 107 40.3 5.1 23 66.7 182.4 35.7 116 112 28.9 48.6 12348 126 96 181 102 462 37.7 33.2 5.4 35.2 14651 23 64.7 18.3 5.2 24.7 16767 27 65.1 119 74.5 68 100 53 19.8 41.5 6.3 5.3 27 17765 61.9 161.9 447 29.8 92.8 33.1 19378 56 63.4 105.5 116 318 31.7 38.2 39.6 20278 57 63.4 255.9 126.5 80 155 85 600 44.9 5.6 43.8 24 62.6 106.7 106 59 237 60.6 34.3 33104 59 63.5 163.1 105 309 28.5 34.4 33106 94.3 67.8 118 94 32.1 23.3 33334 45 60.2 159.7 99.3 104 133 83 280 31 31.1 6.4 5.2 33335 52 67.6 162.8 88 113 75 254 39.4 7.1 5.3 31.8 35035 64.1 95.5 596 30.9 39.2 62.7 79.5 95 301 31 35273 23 61.3 69.1 72 108 72 223 21.2 36.6 5.9 35505 47 58.2 195.6 105.5 88 114 79 293 40.6 27 7.5 5.5 63.2 80 25.5 35507 60.5 135 85.7 60 125 26 39.9 30.9 35984 124 149 37.5 27.9 35988 18 61.8 123.9 72.7 88 46 920 39.7 26.5 36115 29 68 135.5 88 119 271 20.7 39 4.9 124 100.7 106 21.9 33.8Means comparison test for reaction time for drivers before and after alcohol, same person in each row before and after. Ch 15 is relevant Before After 1.74920621 4.071693 1.77395256 5.894565 2.1879452 5.080433 1.34267011 4.882243 2.586359 4.070682 2.22650219 3.466084 2.68646844 5.57166 2.03056345 4.954647 2.76387023 4.904901 1.32359628 0.345885 1.56455148 6.322174 2.2282413 6.076513 2.22767718 3.08039 2.64692607 4.446219 1.81156604 5.661636 1.93772312 3.452929 2.15881886 5.327803 1.9604052 7.838511Means comparison test for reaction time for drivers before and after alcohol in Placebo and Alcohol groups, different people in groups, Ch 15 is relevant Placebo Alcohol 1.017482 4.573129 1.922631 4.948553 1.717669 4.426413 2.603739 4.392403 1.230383 3.580696 1.705844 5.279889 1.544541 3.75895 1.19682 5.567572 2.359001 3.045358 3.53664 4.288635 1.817886 4.38331 0.829309 4.520999 1.812292 4.085442 1.590856 5.144206 2.865826 3.717506 2.232019 1.091296 2.226443 2.795174 1.556555 3.746229 1.675882 3.359935 1.500669 1.986964Placebo Drug low dose Drug higher dose Perform Chi-Squared independence test using STATDISK Decreased Blood Pressure 60 60 71 No decrease 40 20 19
Step by Step Solution
There are 3 Steps involved in it

Get step-by-step solutions from verified subject matter experts