

Question: need typed answer with correct explanation A histogram is a type of graph that allows us to visualize the distribution of a quantitative (a.k.a numerical)
need typed answer with correct explanation
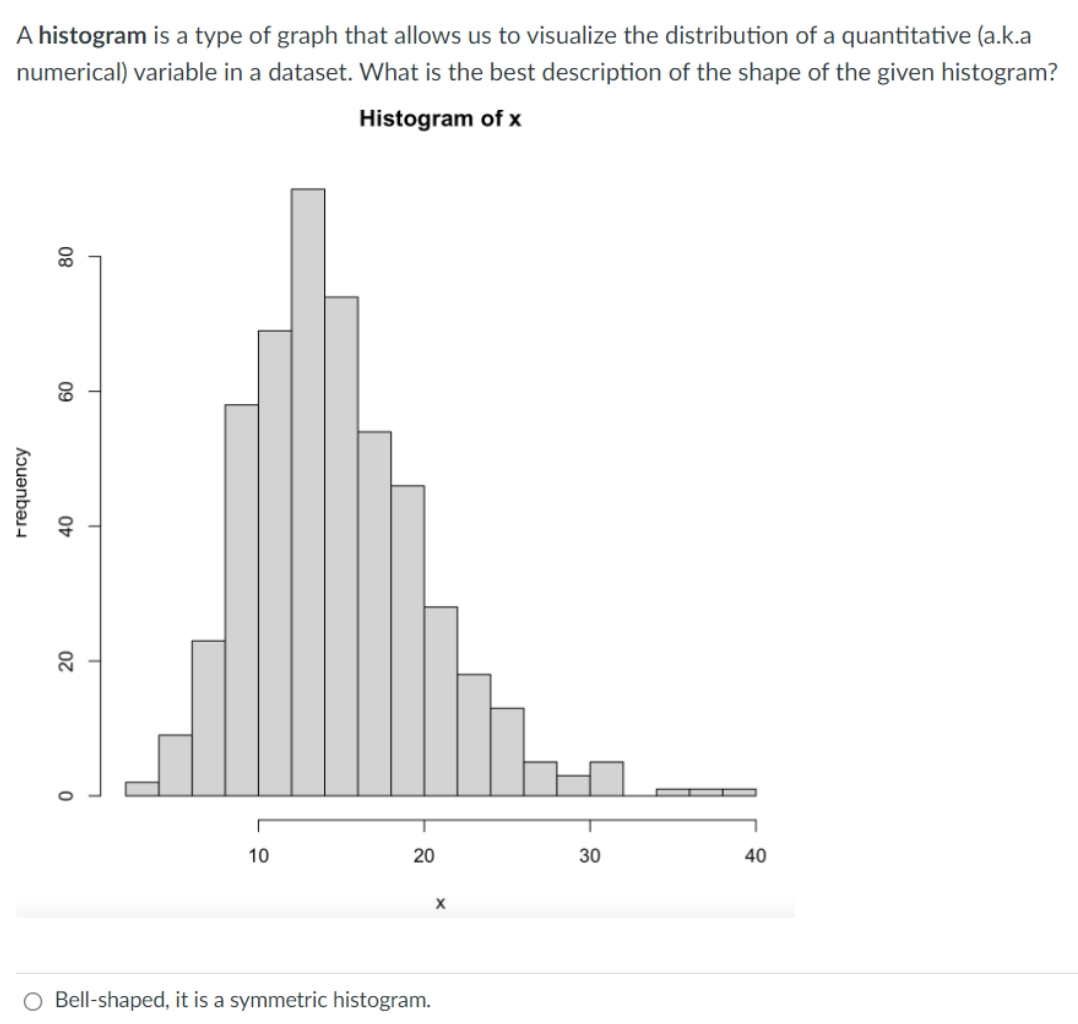
A histogram is a type of graph that allows us to visualize the distribution of a quantitative (a.k.a numerical) variable in a dataset. What is the best description of the shape of the given histogram? Histogram of x 30 rmquancy 4O O Bell-shaped. it is a symmetric histogram
Step by Step Solution
There are 3 Steps involved in it
1 Expert Approved Answer
Step: 1 Unlock

Question Has Been Solved by an Expert!
Get step-by-step solutions from verified subject matter experts
Step: 2 Unlock
Step: 3 Unlock