

Question: Need urgent help with these practice questions (Grade 11 Functions - Exponential Functions) (fyi- the questions are based of the chart in the image that
Need urgent help with these practice questions (Grade 11 Functions - Exponential Functions)
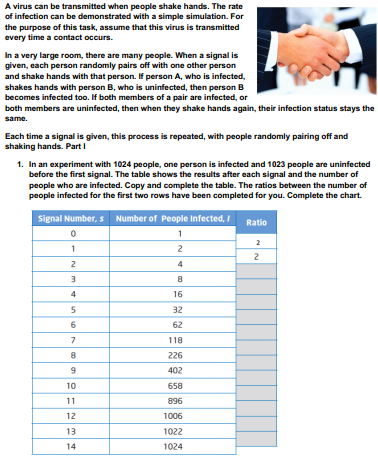
(fyi- the questions are based of the chart in the image that is included)
Questions
- a) What is the domain and range
- b) Can you think of any factors that might lead to restrictions on the domain and range of this model?
- c) Over what domain and range does the model representing the spread of infection approximately fit an exponential function?
1. Does the number of people infected grow exponentially until everyone in the room is infected? Provide a reasonable explanation and include data from the table to support your answer.
2. What will happen to table of values/chart, if each person shakes hand with 2 other persons instead of one? Explain.
3. What will happen to table of values/chart, if there are 5 persons infected? Explain.
4. Make your own realistic relationship that can be modeled by an exponential function, and provide the following:
a) The equation of the exponential function with the meaning of each variable
b) Make a realistic word problem where your equation could be used to solve the problem
c) An algebraic and graphical solution to your problem based on your equation of the exponential function
Step by Step Solution
There are 3 Steps involved in it

Get step-by-step solutions from verified subject matter experts