

Question: Need your help Let Us Discover This Simplified Self-Learning Module (SSLM) will help you understand how to calculate the Pearson's sample correlations coefficient and solve
Need your help
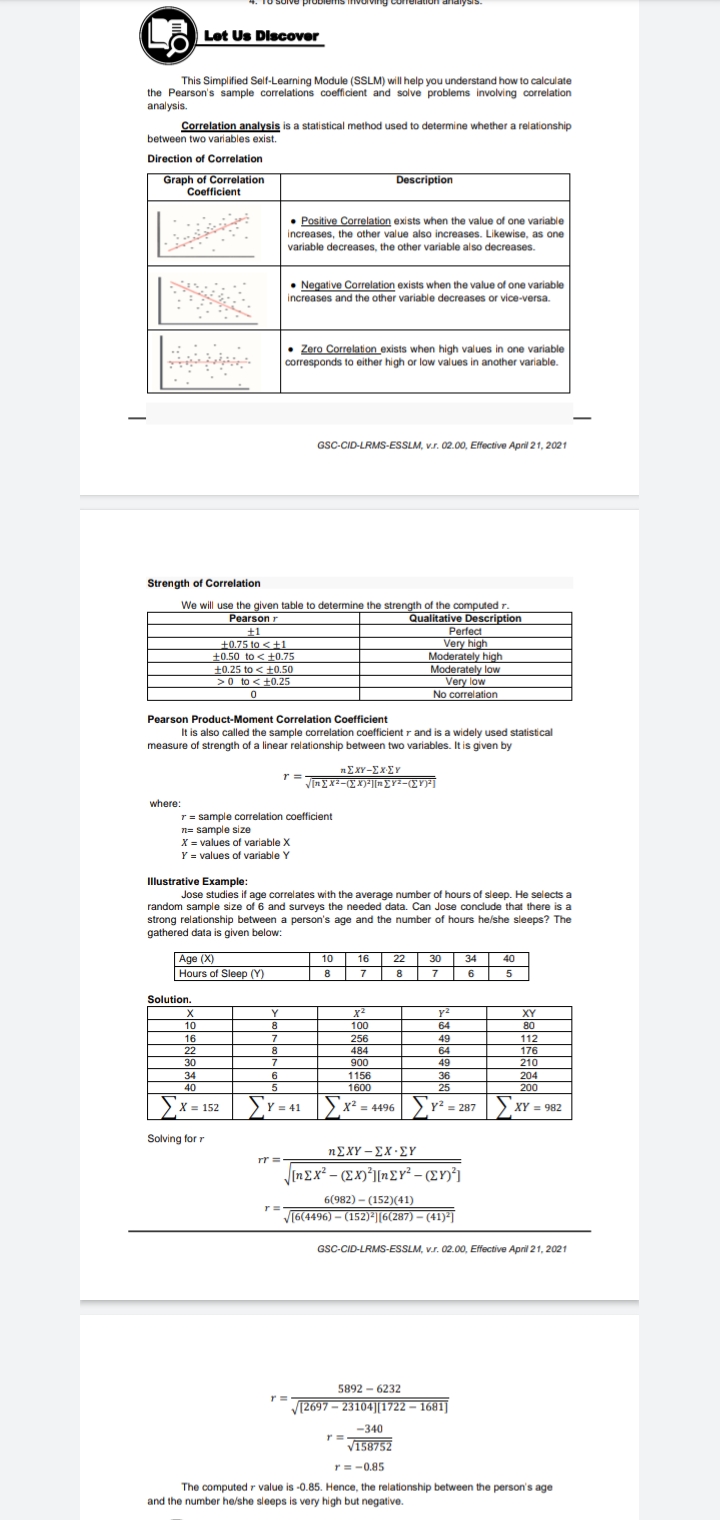
Let Us Discover This Simplified Self-Learning Module (SSLM) will help you understand how to calculate the Pearson's sample correlations coefficient and solve problems involving correlation analysis Correlation analysis is a statistical method used to determine whether a relationship between two variables exist. Direction of Correlation Graph of Correlation Description Coefficient . Positive Correlation exists when the value of one variable increases, the other value also increases. Likewise, as one variable decreases, the other variable also decreases. . Negative Correlation exists when the value of one variable increases and the other variable decreases or vice-versa. . Zero Correlation exists when high values in one variable corresponds to either high or low values in another variable. GSC-CID-LRMS-ESSLM, v.r. 02.00, Effective April 21, 2021 Strength of Correlation We will use the given table to determine the strength of the computed r. Pearson r Qualitative Description Perfect +0.75 10 0 to
Step by Step Solution
There are 3 Steps involved in it

Get step-by-step solutions from verified subject matter experts