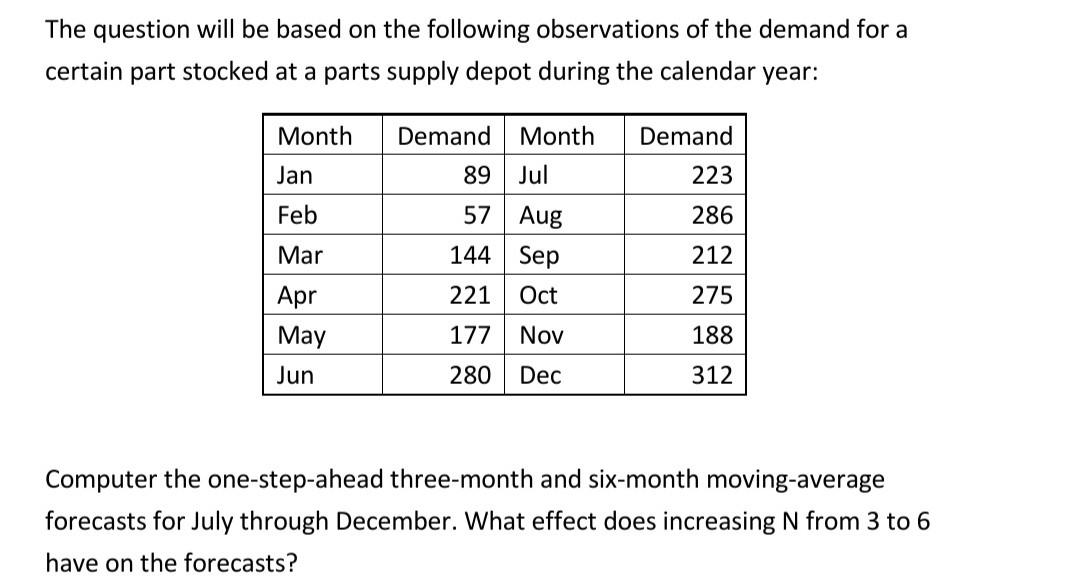
Question: need your help with these questions The question will be based on the following observations of the demand for a certain part stocked at a

need your help with these questions

need your help with these questions The question

need your help with these questions The question

need your help with these questions The question

need your help with these questions The question

The question will be based on the following observations of the demand for a certain part stocked at a parts supply depot during the calendar year: Month Demand Month Demand Jan 89 Jul 223 Feb 57 Aug 286 Mar 144 Sep 212 Apr 221 Oct 275 May 177 Nov 188 Jun 280 Dec 312 Computer the one-step-ahead three-month and six-month moving-average forecasts for July through December. What effect does increasing N from 3 to 6 have on the forecasts? QUESTION #2 Handy, Inc., products a solar-powered electronic calculator that has experienced the following monthly sales history for the first four months of the year, in thousands of units. January 23.3 March 30.3 February 72.3 April 15.5 a. If the forecast for January was 25, determine the one-step-ahead forecasts for February through May using exponential smoothing with a smoothing constant of alpha of 0.15. Show your calculations. b. Repeat the calculation in part (a) for a value of alpha (0.4). What difference in the forecasts do you observe? c. Compute the MSEs for the forecasts you obtained in parts (a) and (b) for February through April. Which value of alpha gave more accurate forecasts, based on the MSE? QUESTION #3 # of Accidents Month (y) X XX x^2 January 30 February 40 March 60 April 90 Totals Averages a. Please fill out the empty cells for the table you have seen above (x, xx, x^2, Totals, Averages). b. Find the linear regression equation. What are the values of a and b the linear regression equation? Show your calculations. c. By using the linear regression equation, please find the forecast value of May. QUESTION #4 Month Year 1 Year 2 Year 3 Year 4 Jan 82 82 82 82 Feb 70 75 84 89 Mar 85 90 82 77 Apr 81 90 90 88 May 80 90 123 119 Jun 89 120 99 99 Jul 100 99 78 89 Aug 89 103 93 100 Sep 86 92 120 86 Oct 80 84 78 84 Nov 75 83 99 80 Dec 78 82 100 82 Please fill out the empty cells in the table above. Average Average Seasonal Period Monthly Monthly Demand Demand Index

Step by Step Solution

There are 3 Steps involved in it

1 Expert Approved Answer
Step: 1 Unlock blur-text-image
Question Has Been Solved by an Expert!

Get step-by-step solutions from verified subject matter experts

Step: 2 Unlock
Step: 3 Unlock

Students Have Also Explored These Related General Management Questions!