Needing help with this market feasibility study. The following information is the pdf I was given as a reference.
I was given this information in order to conduct my own market feasibility study. I personally have never done one so I am unsure of how to even begin. I have started working on the assignment but I am unsure how to continue in order to finish it. The work I have completed so far is below this message.
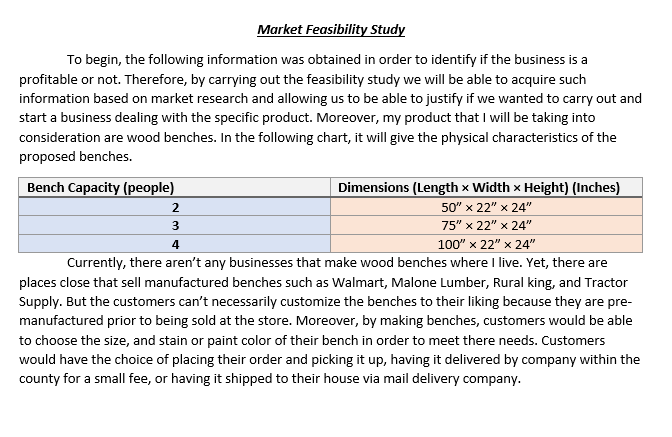
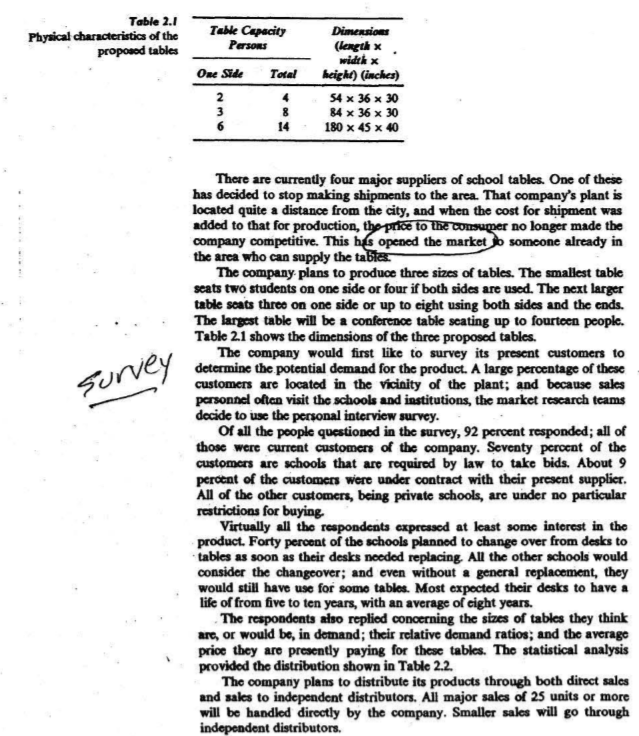
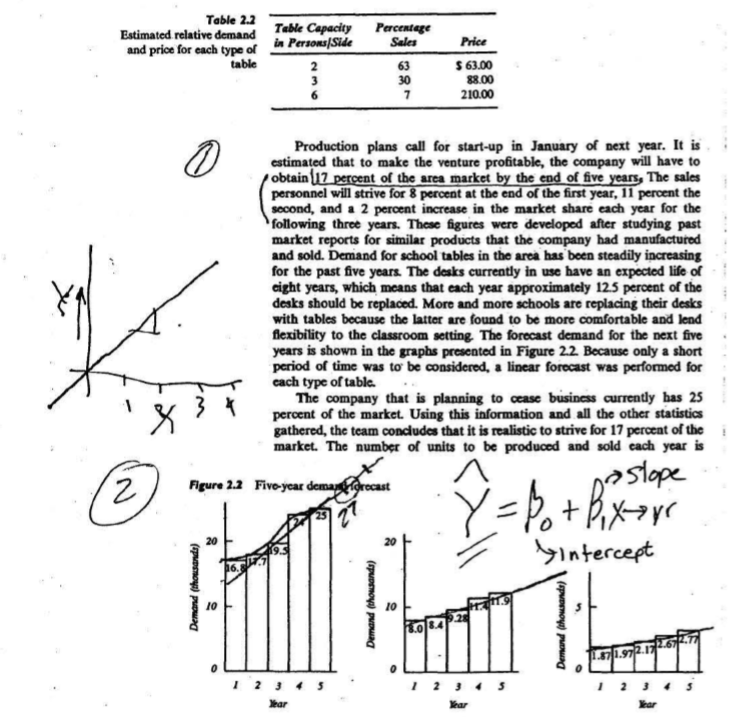
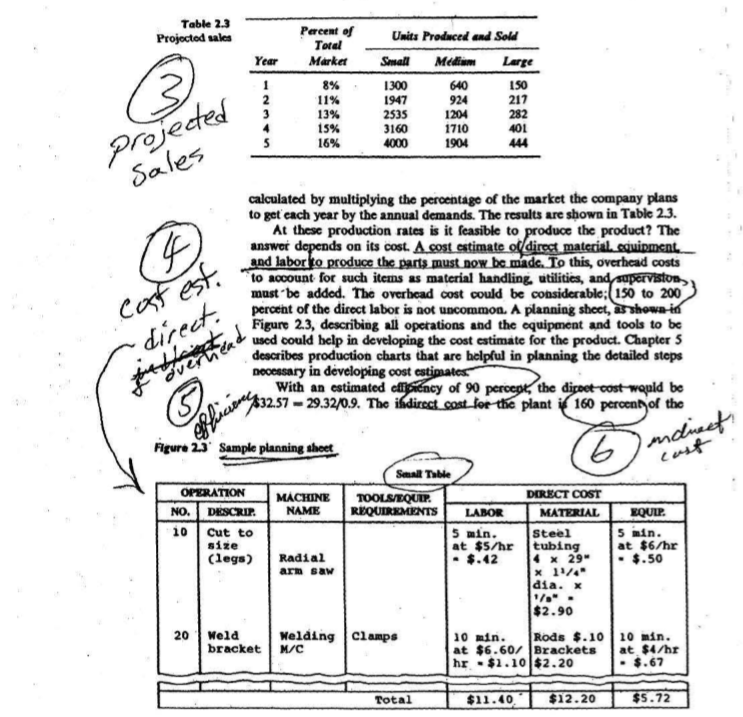
Table 2.1 Physical characteristics of the proposed tables Dimensions (length x width x Table Capacity Persons One Side Total 2 8 6 height) (inches) 54 x 36 x 30 84 x 36 x 30 180 x 45 x 40 survey There are currently four major suppliers of school tables. One of these has decided to stop making shipments to the area. That company's plant is located quite a distance from the city, and when the cost for shipment was added to that for production, the price to the consumer no longer made the company competitive. This has opened the market to someone already in the arca who can supply the table. The company plans to produce three sizes of tables. The smallest table seats two students on one side or four if both sides are used. The next larger table seats three on one side or up to eight using both sides and the ends. The largest table will be a conference table seating up to fourteen people. Table 21 shows the dimensions of the three proposed tables. The company would first like to survey its present customers to determine the potential demand for the product. A large percentage of these customers are located in the vicinity of the plant; and because sales personnel often visit the schools and institutions, the market research teams decide to use the personal interview survey. Of all the people questioned in the survey, 92 percent responded; all of those were current customers of the company. Seventy percent of the customers are schools that are required by law to take bids. About 9 percent of the customers were under contract with their present supplier. All of the other customers, being private schools, are under no particular restrictions for buying Virtually all the respondents expressed at least some interest in the product. Forty percent of the schools planned to change over from desks to tables as soon as their desks needed replacing. All the other schools would consider the changeover; and even without a general replacement, they would still have use for some tables. Most expected their desks to have a life of from five to ten years, with an average of cight years. The respondents also replied concerning the sizes of tables they think arc, or would be, in demand; their relative demand ratios, and the average price they are presently paying for these tables. The statistical analysis provided the distribution shown in Table 2.2. The company plans to distribute its products through both direct sales and sales to independent distributors. All major sales of 25 units or more will be handled directly by the company. Smaller sales will go through independent distributors, Table 2.2 Estimated relative demand and price for each type of table Table Capacity in Persons|Side 2 3 6 Percentage Sales 63 30 7 Price S 63.00 88.00 210.00 0 Production plans call for start-up in January of next year. It is estimated that to make the venture profitable, the company will have to obtain (17 percent of the area market by the end of five years. The sales personnel will strive for 8 percent at the end of the first year, 11 percent the second, and a 2 percent increase in the market share each year for the following three years. These figures were developed after studying past market reports for similar products that the company had manufactured and sold. Demand for school tables in the area has been steadily increasing for the past five years. The desks currently in use have an expected life of cight years, which means that each year approximately 12.5 percent of the desks should be replaced. More and more schools are replacing their desks with tables because the latter are found to be more comfortable and lend flexibility to the classroom setting. The forecast demand for the next five years is shown in the graphs presented in Figure 2.2 Because only a short period of time was to be considered, a linear forecast was performed for cach type of table The company that is planning to cease business currently has 25 percent of the market. Using this information and all the other statistics gathered, the team concludes that it is realistic to strive for 17 percent of the market. The number of units to be produced and sold cach year is 2 Figure 2.2 Five-year demanariorecast postope '=fo + Bixare 20 20 intercept Demand (thousands) 10 Demand (thousands) 10 34 Demand (thousands) Whar Year Year Table 2.3 Projected sales Percent of Toral Market 8% Year 1 2 3 Units Produced and Sold Small Medium Large 1300 640 150 1947 924 2535 1204 282 3160 1710 401 4000 1904 217 13% 15% 16% 5 projected Sales 14 cost est. direct. calculated by multiplying the percentage of the market the company plans to get each year by the annual demands. The results are shown in Table 2.3. At these production rates is it feasible to produce the product? The answer depends on its cost. A cost estimate of direct material. sguipment. and labor to produce the parts must now be made. To this, overhead costs to account for such items as material handling, utilities, and supervision must be added. The overhead cost could be considerable: 150 to 200 percent of the direct labor is not uncommon. A planning sheet, as shown in Figure 2.3, describing all operations and the equipment and tools to be used could help in developing the cost estimate for the product. Chapter 5 describes production charts that are helpful in planning the detailed steps necessary in developing cost estimates With an estimated cliency of 90 percent, the direct cost-would be 4832.57 29.320.9. The indirect cost for the plant is 160 percent of the efficiens 6 indirect Figure 23 sample planning sheet Small Thobile OPERATION MACHINE TOOLSEQUIP DIRECT COST NO. DESCRIP NAME REQUIREMENTS LABOR MATERIAL EQUIP 10 Cut to 5 min. Steel 5 min. size at $5/hr tubing at $6/hr (legs) Radial . $.42 4 X 29" .$.50 arm saw x 1/4" dia. X 1/2"- $2.90 20 Wela Welding Clamps 10 min. Rods $.10 20 min. bracket M/C at $6.607 Brackets at $4/hr hr - $1.10 $2.20 . $.67 Total $11.40 $12.20 $5.72 7 acnee Srt profil direct labor, or $20.27 (11.40/0.90 x 1.6), giving a cost for manufacturing o $52.84. If we add $1.20 for administration and packaging/shipping, the ne cost to the company is $54.04. Since the unit is expected to sell for $63.00, i will generate a profit of $8.96. Similar analysis on other types of tables results in profit of $10.20 foi medium tables and $18.15 for large tables. Based on projected sales from the previous chart, the yearly profit is as follows: Year Profit 1 $21,292.74 2. $30,808.47 $40,143.30 $56,976.15 5 $63,319.40 This gives a rough estimate of the average yearly profit of 542,508.01 The management expects the need for an additional investment of $125,00 to engage in the planned level of activity. Assuming a five-year life for the project, the internal rate of return for this investment is 17 percent, and since the company's minimum attractive rate of return before taxes is 15 percent, the project is accepted. & profit decirin if feasible, 2.2 Quality Function Deployment (QFD) Along with market research, quality function deployment (QFD) is playing an increasingly important role in product development. QFD was first applied in Japan; the concept is now becoming Popular and successful in Kmerican industries. QFD calls for a stractured process of converting as tomer requirements into design and manulacturing coeds. It is a manage ment plammg technique wherein group discussions among concerned personnel are held and clear consensus on how the customer needs are to be achieved is reached QFD can be used in any phase of production. For example, for the entire facility, the customer may be the ultimate consumer of the product, whereas within the plant, the consumer may be the next sequential department that would process the part. QFD is also used to compare a product against its competitors in the market. Development of QFD may start with identifying the customer internal or external to the organization) and his or her wants. Questions such as what, when, where, why, and how the customer will use the product may help in identifying his or her noods. For example, in developing a coffee maker, the customer is clearly an external consumer who would make and drink the coffee. The customer could be a restaurant operator or an individ- Market Feasibility Study To begin, the following information was obtained in order to identify if the business is a profitable or not. Therefore, by carrying out the feasibility study we will be able to acquire such information based on market research and allowing us to be able to justify if we wanted to carry out and start a business dealing with the specific product. Moreover, my product that I will be taking into consideration are wood benches. In the following chart, it will give the physical characteristics of the proposed benches. Bench Capacity (people) Dimensions (Length x Width x Height) (Inches) 50" x 22" x 24" 75" x 22" x 24" 100" x 22" x 24" Currently, there aren't any businesses that make wood benches where I live. Yet, there are places close that sell manufactured benches such as Walmart, Malone Lumber, Rural king, and Tractor Supply. But the customers can't necessarily customize the benches to their liking because they are pre- manufactured prior to being sold at the store. Moreover, by making benches, customers would be able to choose the size, and stain or paint color of their bench in order to meet there needs. Customers would have the choice of placing their order and picking it up, having it delivered by company within the county for a small fee, or having it shipped to their house via mail delivery company. 2 3 4 Table 2.1 Physical characteristics of the proposed tables Dimensions (length x width x Table Capacity Persons One Side Total 2 8 6 height) (inches) 54 x 36 x 30 84 x 36 x 30 180 x 45 x 40 survey There are currently four major suppliers of school tables. One of these has decided to stop making shipments to the area. That company's plant is located quite a distance from the city, and when the cost for shipment was added to that for production, the price to the consumer no longer made the company competitive. This has opened the market to someone already in the arca who can supply the table. The company plans to produce three sizes of tables. The smallest table seats two students on one side or four if both sides are used. The next larger table seats three on one side or up to eight using both sides and the ends. The largest table will be a conference table seating up to fourteen people. Table 21 shows the dimensions of the three proposed tables. The company would first like to survey its present customers to determine the potential demand for the product. A large percentage of these customers are located in the vicinity of the plant; and because sales personnel often visit the schools and institutions, the market research teams decide to use the personal interview survey. Of all the people questioned in the survey, 92 percent responded; all of those were current customers of the company. Seventy percent of the customers are schools that are required by law to take bids. About 9 percent of the customers were under contract with their present supplier. All of the other customers, being private schools, are under no particular restrictions for buying Virtually all the respondents expressed at least some interest in the product. Forty percent of the schools planned to change over from desks to tables as soon as their desks needed replacing. All the other schools would consider the changeover; and even without a general replacement, they would still have use for some tables. Most expected their desks to have a life of from five to ten years, with an average of cight years. The respondents also replied concerning the sizes of tables they think arc, or would be, in demand; their relative demand ratios, and the average price they are presently paying for these tables. The statistical analysis provided the distribution shown in Table 2.2. The company plans to distribute its products through both direct sales and sales to independent distributors. All major sales of 25 units or more will be handled directly by the company. Smaller sales will go through independent distributors, Table 2.2 Estimated relative demand and price for each type of table Table Capacity in Persons|Side 2 3 6 Percentage Sales 63 30 7 Price S 63.00 88.00 210.00 0 Production plans call for start-up in January of next year. It is estimated that to make the venture profitable, the company will have to obtain (17 percent of the area market by the end of five years. The sales personnel will strive for 8 percent at the end of the first year, 11 percent the second, and a 2 percent increase in the market share each year for the following three years. These figures were developed after studying past market reports for similar products that the company had manufactured and sold. Demand for school tables in the area has been steadily increasing for the past five years. The desks currently in use have an expected life of cight years, which means that each year approximately 12.5 percent of the desks should be replaced. More and more schools are replacing their desks with tables because the latter are found to be more comfortable and lend flexibility to the classroom setting. The forecast demand for the next five years is shown in the graphs presented in Figure 2.2 Because only a short period of time was to be considered, a linear forecast was performed for cach type of table The company that is planning to cease business currently has 25 percent of the market. Using this information and all the other statistics gathered, the team concludes that it is realistic to strive for 17 percent of the market. The number of units to be produced and sold cach year is 2 Figure 2.2 Five-year demanariorecast postope '=fo + Bixare 20 20 intercept Demand (thousands) 10 Demand (thousands) 10 34 Demand (thousands) Whar Year Year Table 2.3 Projected sales Percent of Toral Market 8% Year 1 2 3 Units Produced and Sold Small Medium Large 1300 640 150 1947 924 2535 1204 282 3160 1710 401 4000 1904 217 13% 15% 16% 5 projected Sales 14 cost est. direct. calculated by multiplying the percentage of the market the company plans to get each year by the annual demands. The results are shown in Table 2.3. At these production rates is it feasible to produce the product? The answer depends on its cost. A cost estimate of direct material. sguipment. and labor to produce the parts must now be made. To this, overhead costs to account for such items as material handling, utilities, and supervision must be added. The overhead cost could be considerable: 150 to 200 percent of the direct labor is not uncommon. A planning sheet, as shown in Figure 2.3, describing all operations and the equipment and tools to be used could help in developing the cost estimate for the product. Chapter 5 describes production charts that are helpful in planning the detailed steps necessary in developing cost estimates With an estimated cliency of 90 percent, the direct cost-would be 4832.57 29.320.9. The indirect cost for the plant is 160 percent of the efficiens 6 indirect Figure 23 sample planning sheet Small Thobile OPERATION MACHINE TOOLSEQUIP DIRECT COST NO. DESCRIP NAME REQUIREMENTS LABOR MATERIAL EQUIP 10 Cut to 5 min. Steel 5 min. size at $5/hr tubing at $6/hr (legs) Radial . $.42 4 X 29" .$.50 arm saw x 1/4" dia. X 1/2"- $2.90 20 Wela Welding Clamps 10 min. Rods $.10 20 min. bracket M/C at $6.607 Brackets at $4/hr hr - $1.10 $2.20 . $.67 Total $11.40 $12.20 $5.72 7 acnee Srt profil direct labor, or $20.27 (11.40/0.90 x 1.6), giving a cost for manufacturing o $52.84. If we add $1.20 for administration and packaging/shipping, the ne cost to the company is $54.04. Since the unit is expected to sell for $63.00, i will generate a profit of $8.96. Similar analysis on other types of tables results in profit of $10.20 foi medium tables and $18.15 for large tables. Based on projected sales from the previous chart, the yearly profit is as follows: Year Profit 1 $21,292.74 2. $30,808.47 $40,143.30 $56,976.15 5 $63,319.40 This gives a rough estimate of the average yearly profit of 542,508.01 The management expects the need for an additional investment of $125,00 to engage in the planned level of activity. Assuming a five-year life for the project, the internal rate of return for this investment is 17 percent, and since the company's minimum attractive rate of return before taxes is 15 percent, the project is accepted. & profit decirin if feasible, 2.2 Quality Function Deployment (QFD) Along with market research, quality function deployment (QFD) is playing an increasingly important role in product development. QFD was first applied in Japan; the concept is now becoming Popular and successful in Kmerican industries. QFD calls for a stractured process of converting as tomer requirements into design and manulacturing coeds. It is a manage ment plammg technique wherein group discussions among concerned personnel are held and clear consensus on how the customer needs are to be achieved is reached QFD can be used in any phase of production. For example, for the entire facility, the customer may be the ultimate consumer of the product, whereas within the plant, the consumer may be the next sequential department that would process the part. QFD is also used to compare a product against its competitors in the market. Development of QFD may start with identifying the customer internal or external to the organization) and his or her wants. Questions such as what, when, where, why, and how the customer will use the product may help in identifying his or her noods. For example, in developing a coffee maker, the customer is clearly an external consumer who would make and drink the coffee. The customer could be a restaurant operator or an individ- Market Feasibility Study To begin, the following information was obtained in order to identify if the business is a profitable or not. Therefore, by carrying out the feasibility study we will be able to acquire such information based on market research and allowing us to be able to justify if we wanted to carry out and start a business dealing with the specific product. Moreover, my product that I will be taking into consideration are wood benches. In the following chart, it will give the physical characteristics of the proposed benches. Bench Capacity (people) Dimensions (Length x Width x Height) (Inches) 50" x 22" x 24" 75" x 22" x 24" 100" x 22" x 24" Currently, there aren't any businesses that make wood benches where I live. Yet, there are places close that sell manufactured benches such as Walmart, Malone Lumber, Rural king, and Tractor Supply. But the customers can't necessarily customize the benches to their liking because they are pre- manufactured prior to being sold at the store. Moreover, by making benches, customers would be able to choose the size, and stain or paint color of their bench in order to meet there needs. Customers would have the choice of placing their order and picking it up, having it delivered by company within the county for a small fee, or having it shipped to their house via mail delivery company. 2 3 4


