

Question: Needing serious help coming up with a journal article. First screenshot is the sample data provided. Second screenshot is a summary of the estimates i
Needing serious help coming up with a journal article.
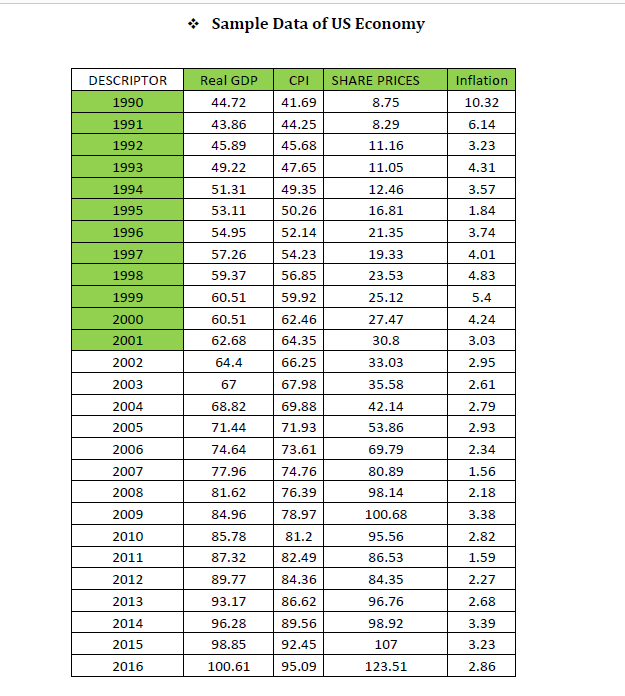
First screenshot is the sample data provided.
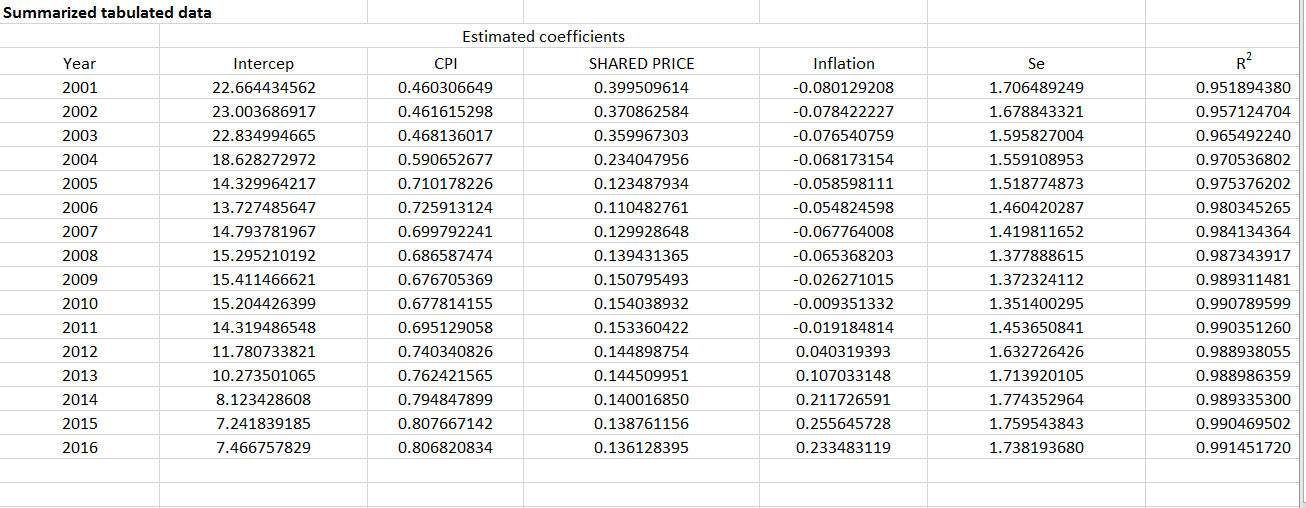
Second screenshot is a summary of the estimates i generated using excel. 1990 - 2001, 1990 - 2002, 1990 - 2003 .......
Here are the instructions.
Title, Abstract, Introduction, Method, Results, and Discussion.
a)Abstractis a very concise summary of the paper.
b)Introductiontells the reader about the topic. Specifically, it should start with the purpose of this paper is to examine.... What the issue is, what is known about it, and the specific focus? Put a business context to it -- write the value added by yourwork or what businesses can gain from the knowledge of the determinants of market profits.
c)Empirical Resultsyou should start with a brief discussion of the descriptive statistics for each variable.
d)Methodyou should be able to explain what method you are using for your work.For example, you can start with telling the reader that the ordinary least squares method (OLS) was used to obtain estimated coefficients... (Then write more). You should be able to write the equation from the Excel result.
We expect to see you...
1. Using the excel result to generate the equation.
2. Find the standard error of each variable.
3. Find the t-stat of each variable.
4. Find the p-value of each variable.
\f\f
Step by Step Solution
There are 3 Steps involved in it

Get step-by-step solutions from verified subject matter experts