

Question: Needs to be set up in a cash flow spreadsheet 2:10 PM Thu Apr 16 74% Done Project Part 4.xlsx Project 1 Good Economy Years
Needs to be set up in a cash flow spreadsheet
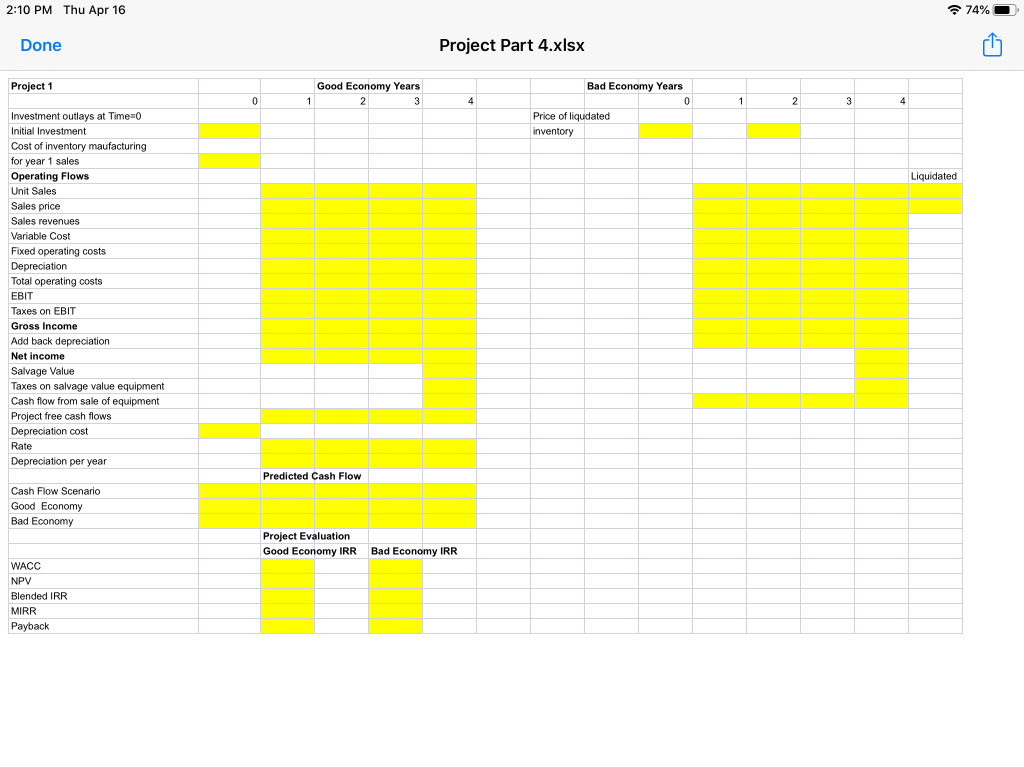
2:10 PM Thu Apr 16 74% Done Project Part 4.xlsx Project 1 Good Economy Years Bad Economy Years 0 1 1 2 3 Price of liqudated inventory Liquidated Investment outlays at Time=0 Initial Investment Cost of inventory maufacturing for year 1 sales Operating Flows Unit Sales Sales price Sales revenues Variable Cost Fixed operating costs Depreciation Total operating costs EBIT Taxes on EBIT Gross Income Add back depreciation Net Income Salvage Value Taxes on salvage value equipment Cash flow from sale of equipment Project free cash flows Depreciation cost Rate Depreciation per year Predicted Cash Flow Cash Flow Scenario Good Economy Bad Economy Project Evaluation Good Economy IRR Bad Economy IRR WACC NPV Blended IRR MIRR Payback Project Excel Sheet . Project 1: This project is over the course of 4 years. You will need an investment of $5 million in year 0, $2.5 million for equipment, and $2.5 million to produce inventory for year 1. Depreciation is straight line over the 4 years, and the new equipment purchased is sold at the end of the project for a salvage value of $250,000. Fixed costs are $500,000 per year and the variable costs are 25% of sales revenues. Total inventory produced will be 85,000 units. Sales for year 1 are 15,000, year 2 are estimated to be 20,000 units at $200 each and Year 3 and 4 at 25,000 units at $125 each. The estimated tax rate is 35%. There is a 30% chance that the Economy worsens by Year 2. If so, sales are estimated to decrease 25% less than the previous year each year with no change in price after year 2 and inventory to be liquidated will be at a loss of 25% 2:10 PM Thu Apr 16 74% Done Project Part 4.xlsx Project 1 Good Economy Years Bad Economy Years 0 1 1 2 3 Price of liqudated inventory Liquidated Investment outlays at Time=0 Initial Investment Cost of inventory maufacturing for year 1 sales Operating Flows Unit Sales Sales price Sales revenues Variable Cost Fixed operating costs Depreciation Total operating costs EBIT Taxes on EBIT Gross Income Add back depreciation Net Income Salvage Value Taxes on salvage value equipment Cash flow from sale of equipment Project free cash flows Depreciation cost Rate Depreciation per year Predicted Cash Flow Cash Flow Scenario Good Economy Bad Economy Project Evaluation Good Economy IRR Bad Economy IRR WACC NPV Blended IRR MIRR Payback Project Excel Sheet . Project 1: This project is over the course of 4 years. You will need an investment of $5 million in year 0, $2.5 million for equipment, and $2.5 million to produce inventory for year 1. Depreciation is straight line over the 4 years, and the new equipment purchased is sold at the end of the project for a salvage value of $250,000. Fixed costs are $500,000 per year and the variable costs are 25% of sales revenues. Total inventory produced will be 85,000 units. Sales for year 1 are 15,000, year 2 are estimated to be 20,000 units at $200 each and Year 3 and 4 at 25,000 units at $125 each. The estimated tax rate is 35%. There is a 30% chance that the Economy worsens by Year 2. If so, sales are estimated to decrease 25% less than the previous year each year with no change in price after year 2 and inventory to be liquidated will be at a loss of 25%
Step by Step Solution
There are 3 Steps involved in it

Get step-by-step solutions from verified subject matter experts