

Question: Nestle SA in millions (exce -t or data ner share and em-lo ees 2013 and 2014 2013 2014 Results Sales 92158 91 612 CHF 92,158
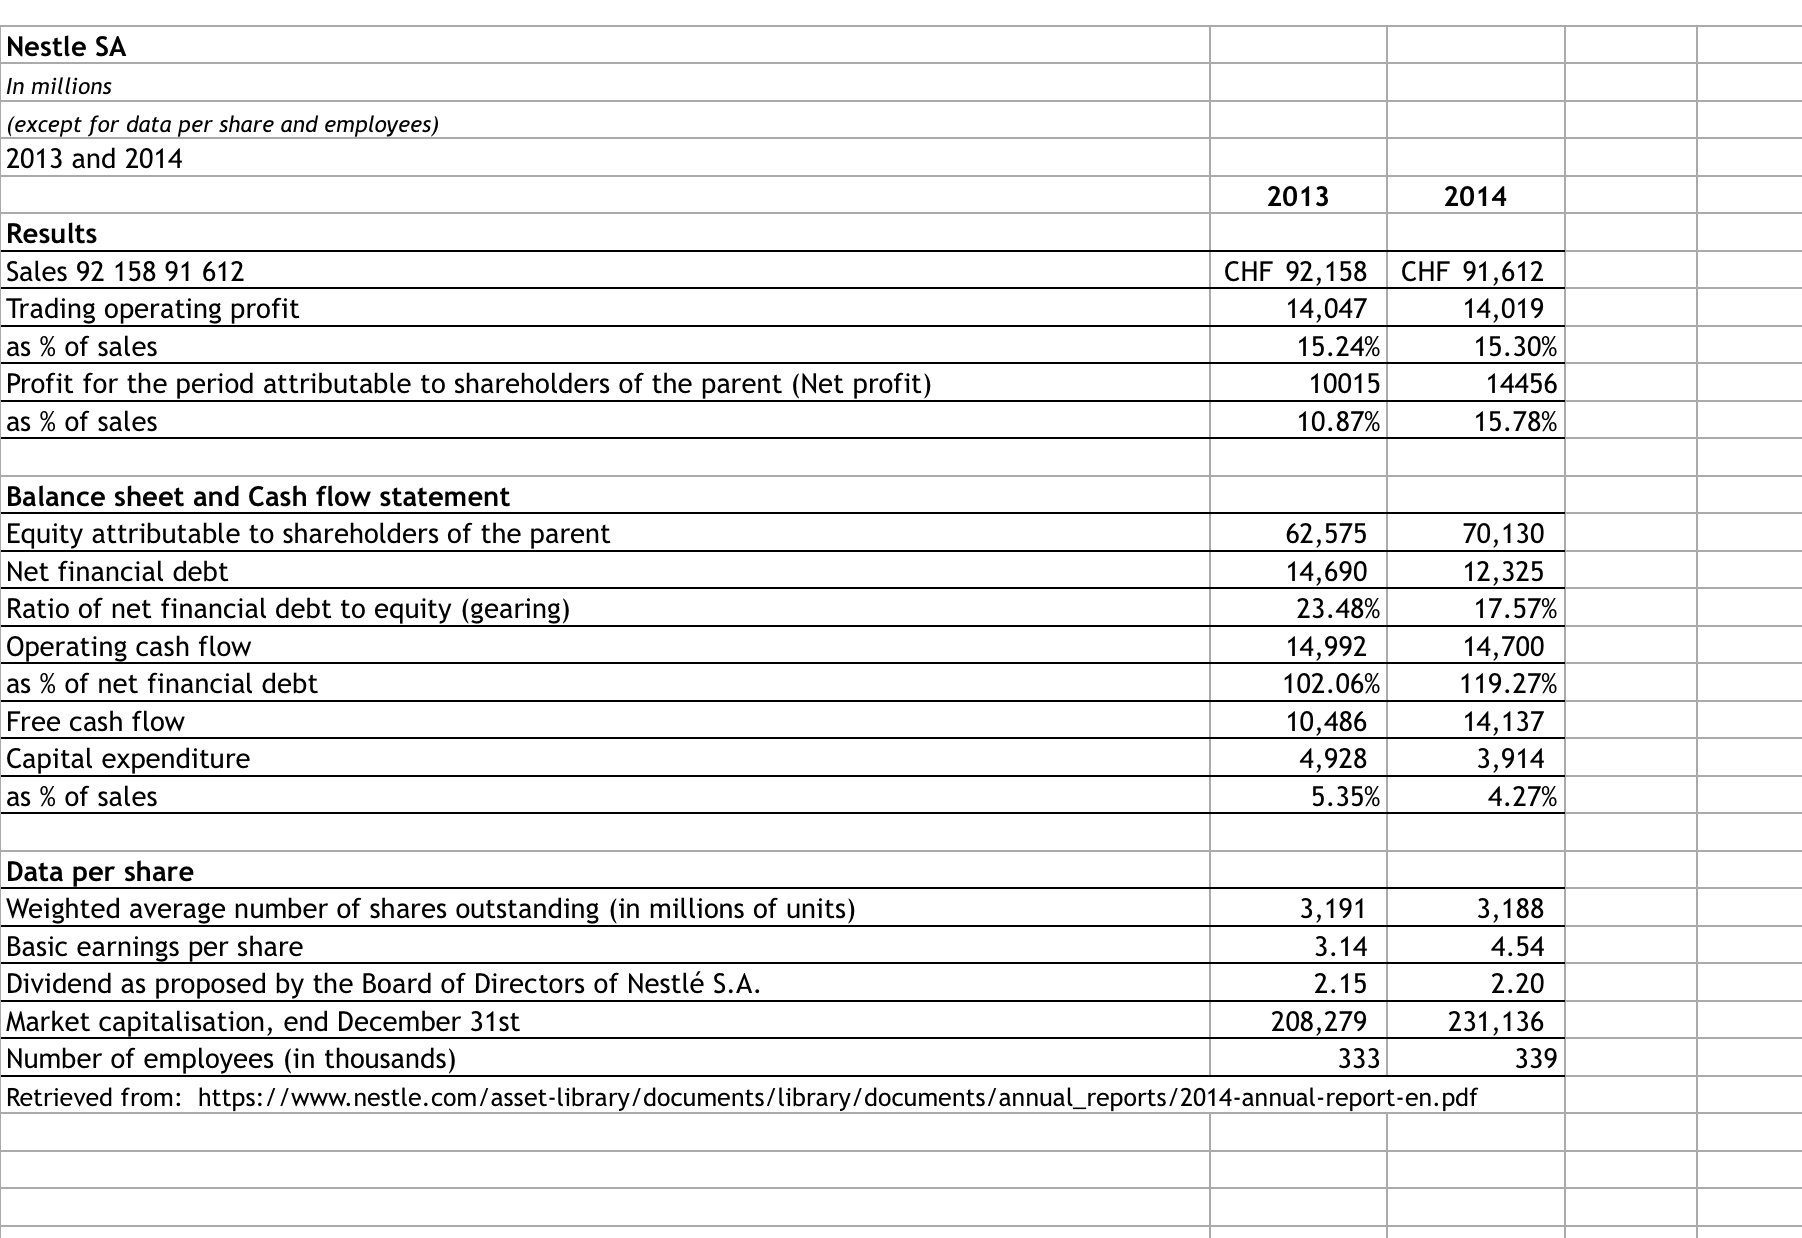
Nestle SA in millions (exce -t or data ner share and em-lo ees 2013 and 2014 2013 2014 Results Sales 92158 91 612 CHF 92,158 CHF 91,612 Trading operating prot 14,047 14,019 as % of sales 15.24% 15.30% Profit for the period attributable to shareholders of the parent (Net profit) 10015 14456 as % of sales 10.87% 15.78% Balance sheet and Cash flow statement Equity attributable to shareholders of the parent 62,575 70,130 Net financial debt 14,690 12,325 Ratio of net financial debt to equity (gearing) 23.48% 17.57% Operating cash flow 14,992 14,700 as % of net financial debt 102.06% 119.27% Free cash flow 10,486 14,137 Capital expenditure 4,928 3,914 as % of sales 5.35% 4.27% Data -er share Weighted average number of shares outstanding (in millions of units) 3,191 3,188 Basic earnings per share 3.14 4.54 Dividend as proposed by the Board of Directors of Nestl S.A. 2.15 2.20 Market capitalisation, end December 31st 208,279 231,136 Number of employees (in thousands) 333 339 Retrieved from: httpszl lwww. nestle.comlasset-library/documents/ libraryldocuments/annual_report512014-annual-report-en.pdf
Step by Step Solution
There are 3 Steps involved in it

Get step-by-step solutions from verified subject matter experts