

Question: Network Diagrams & PERT Question: We are remodeling the da Vinci Lounge in the Spencer Engineering Building. A. Identify the critical path B. Identify the
Network Diagrams & PERT Question:
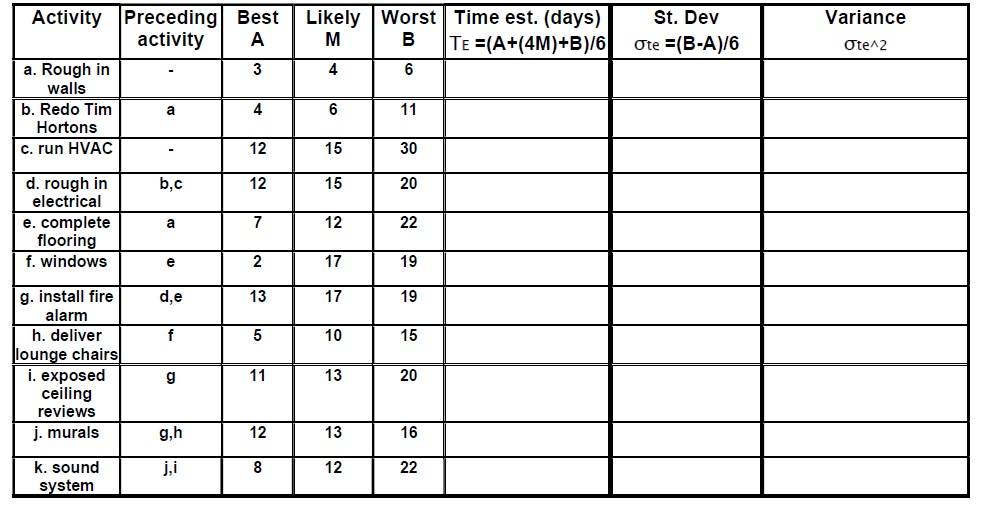
We are remodeling the da Vinci Lounge in the Spencer Engineering Building.
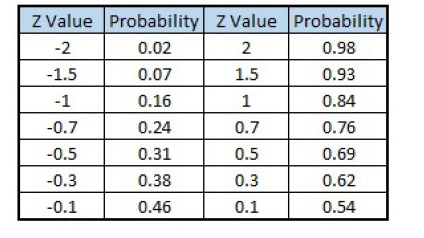
A. Identify the critical path B. Identify the slack for each element C. Identify the most and least sensitive element D. Identify the predicted project duration (TE) E. Z is the number of standard deviations from the mean found in the statistical table below, and defined by the relationship: Z = (Ts - TE) / SQRT(te2 ) where only critical path te are included in the summation. If the companys scheduled time to complete the work (Ts) is 70 days, then what is the likelihood that we finish the remodeling project on time? Express your probability response as a percentage rounded to the nearest integer.
Step by Step Solution
There are 3 Steps involved in it

Get step-by-step solutions from verified subject matter experts