

Question: New Tab 9: New Tab Mathematical Model EX RASHEED BARASHEE X Meet -gks-yvwo O X . RASHEED BARASHEEL X G 2% docs.google.com/document/d/1rsq58LbKLUbB59uW80289JUq7xs-J37dukjz5wbrJHk/edit?pli=1 R . .
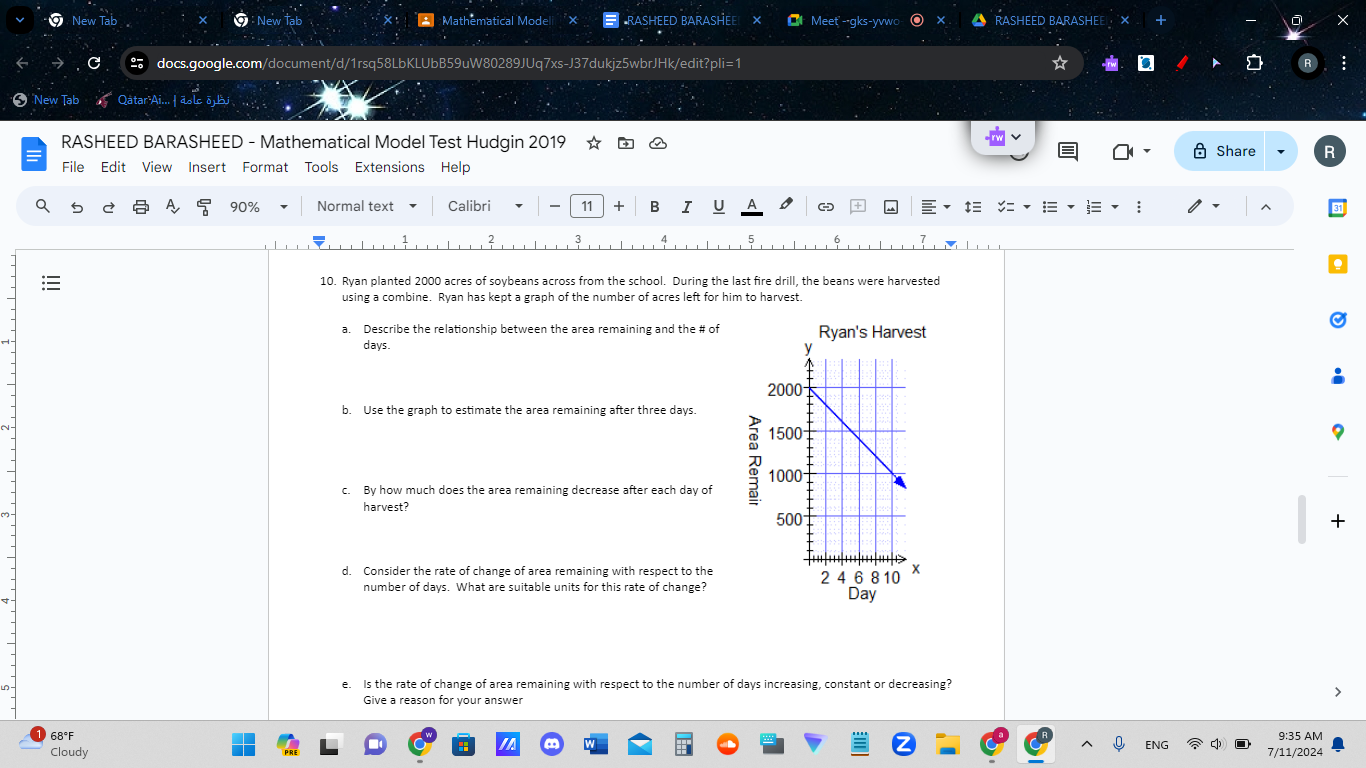
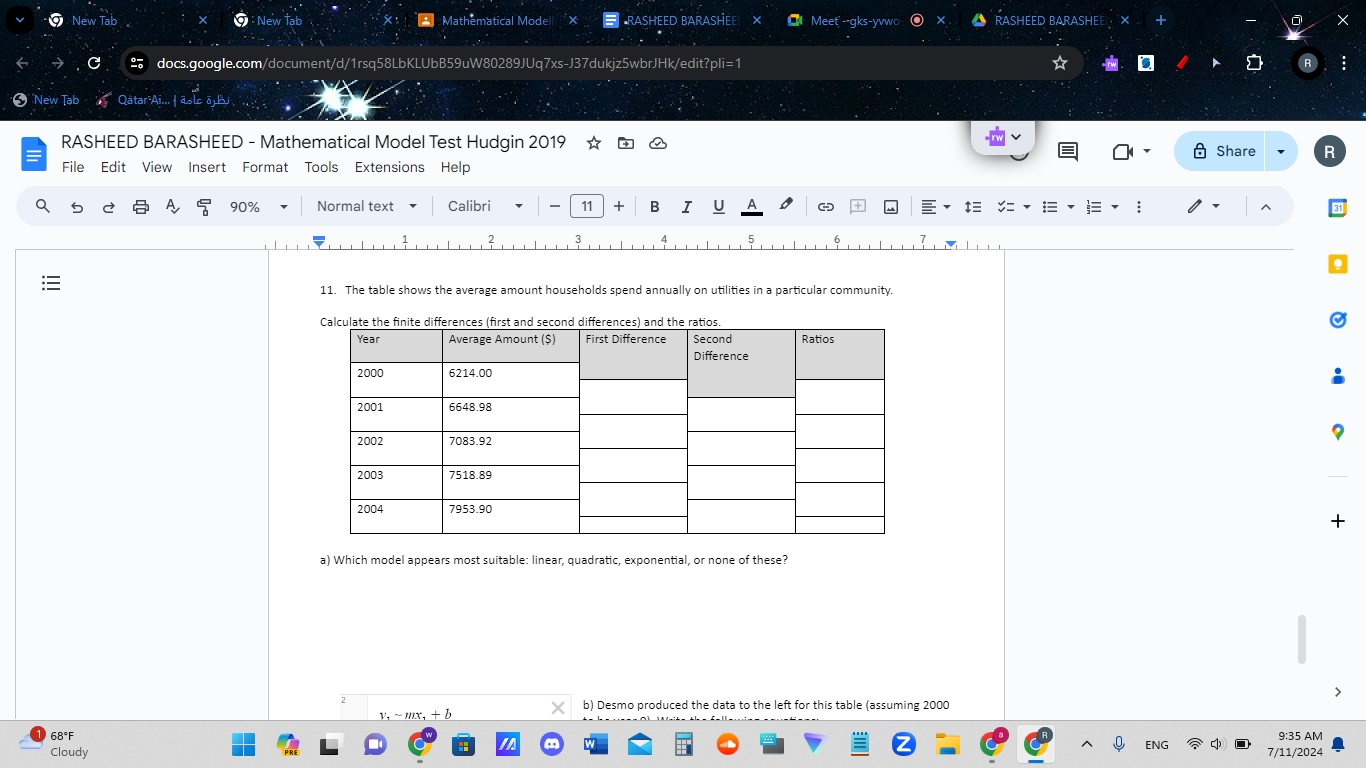
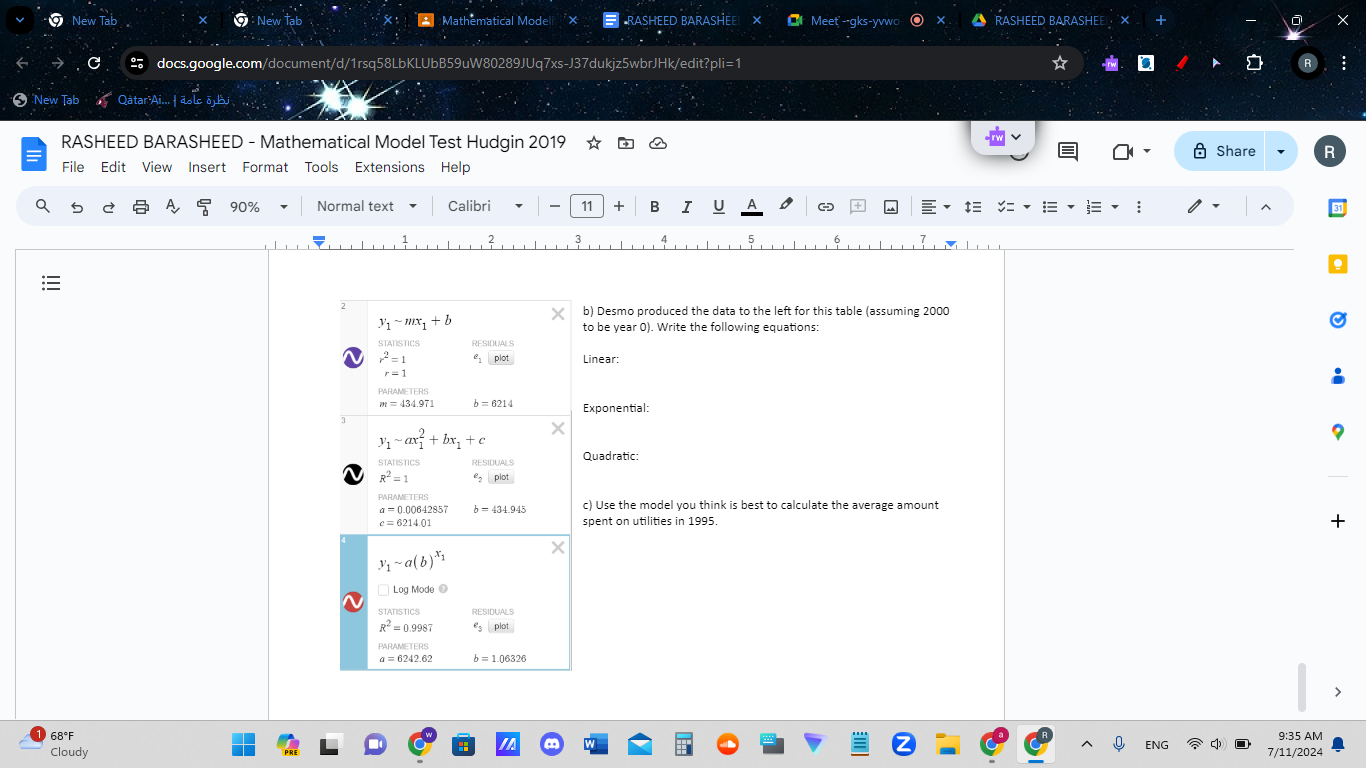
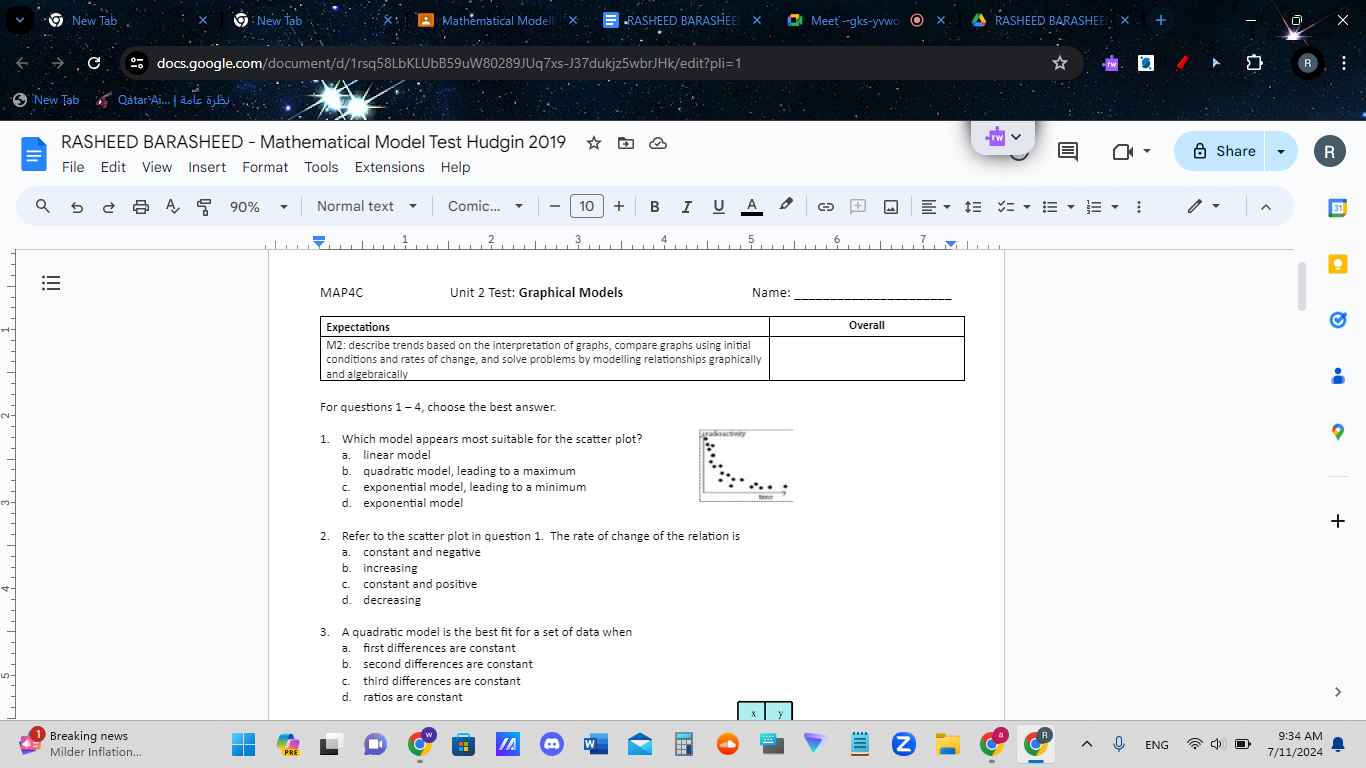
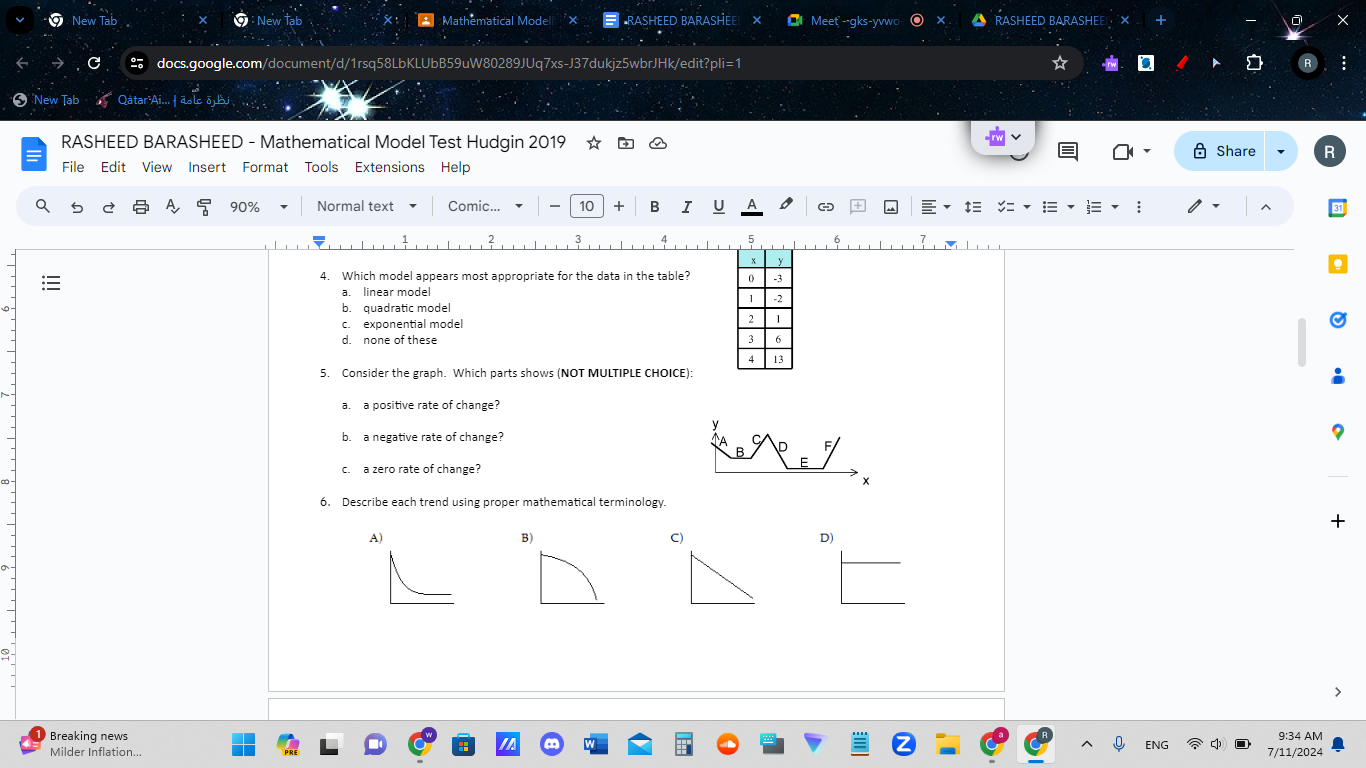
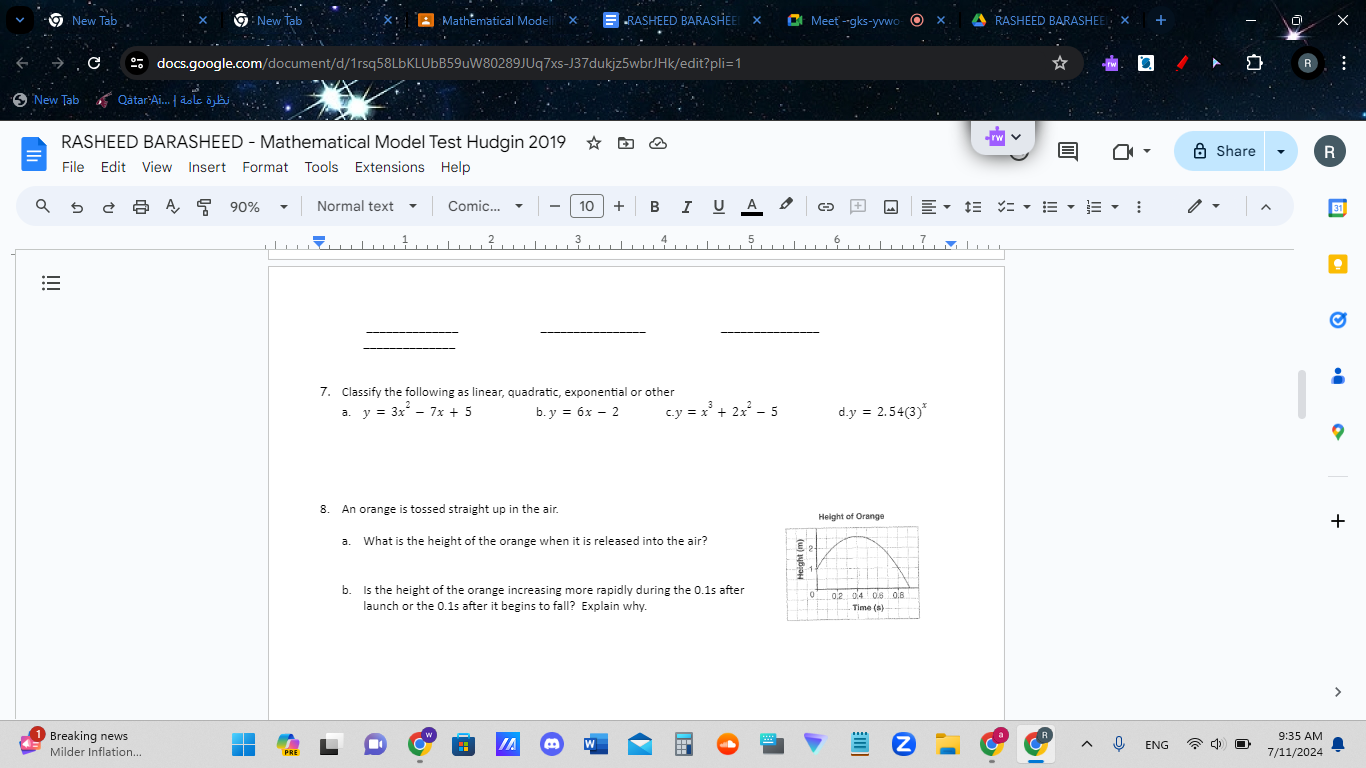
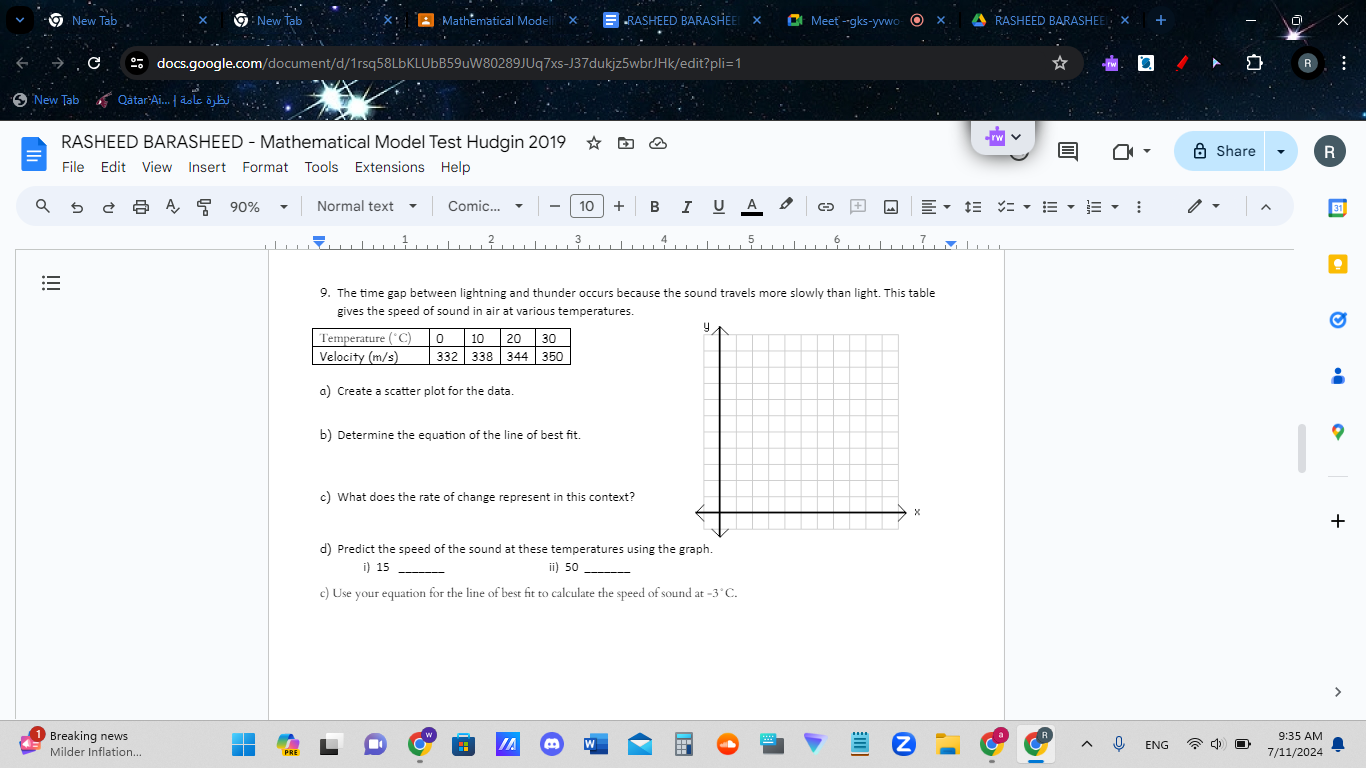
New Tab 9: New Tab Mathematical Model EX RASHEED BARASHEE X Meet -gks-yvwo O X . RASHEED BARASHEEL X G 2% docs.google.com/document/d/1rsq58LbKLUbB59uW80289JUq7xs-J37dukjz5wbrJHk/edit?pli=1 R . . . New Tab Qatar Ai.. | dale bjbj. RASHEED BARASHEED - Mathematical Model Test Hudgin 2019 * & Share R File Edit View Insert Format Tools Extensions Help Q 5 @ A 5 90% - Normal text Calibri 11 + BIUA 31 IE 10. Ryan planted 2000 acres of soybeans across from the school. During the last fire drill, the beans were harvested using a combine. Ryan has kept a graph of the number of acres left for him to harvest. C a. Describe the relationship between the area remaining and the # of days. D. b. Use the graph to estimate the area remaining after three days. Area Remail c. By how much does the area remaining decrease after each day of harvest? + d. Consider the rate of change of area remaining with respect to the 2 4 6 810 X number of days. What are suitable units for this rate of change? Day e. Is the rate of change of area remaining with respect to the number of days increasing, constant or decreasing? Give a reason for your answer 1 68-F 9:35 AM A Z Ca CR U Cloudy ENG ( 0 7/11/2024New Tab 9: New Tab Mathematical Model X RASHEED BARASHEEI X O Meet -gks-yvwo- O X . RASHEED BARASHEEL X G 25 docs.google.com/document/d/1rsq58LbKLUbB59uW80289JUq7xs-J3 RASHEED BARASHEED - Mathematical R . . . Model Test Hudgin 2019 - Google Docs New Tab Qatar Ai... | dole bjbj. docs.google.com RASHEED BARASHEED - Mathematical Model Test Hudgin 2019 Memory usage: 373 MB -rw V Share R File Edit View Insert Format Tools Extensions Help 90% - Normal text Calibri 11 + BI U A D C + M B 13 % BY : 31 IE C f. Predict the number of days required to complete the harvest. Show your work. D. + 1 68 F 9:35 AM W CA U Cloudy ENG ( 0 7/11/2024New Tab 9: New Tab Mathematical Model RASHEED BARASHEE X Meet -gks-yvwo O X . RASHEED BARASHEEL X G 25 docs.google.com/document/d/1rsq58LbKLUbB59uW80289JUq7xs-J37dukjz5wbrJHk/edit?pli=1 R . . . New Tab Qatar Ai... | dole bjbj. RASHEED BARASHEED - Mathematical Model Test Hudgin 2019 * & Share R File Edit View Insert Format Tools Extensions Help Q 5 @ A 5 90% - Normal text Calibri 11 + B I U A D C + M B . 13 % BY : 31 IE 11. The table shows the average amount households spend annually on utilities in a particular community. Calculate the finite differences (first and second differences) and the ratios. C Year Average Amount ($) First Difference Second Ratios Difference 200 6214.00 D. 2001 6648.98 2002 7083.92 2003 7518.89 2004 7953.90 + a) Which model appears most suitable: linear, quadratic, exponential, or none of these? 2 V, ~ mix, + b X b) Desmo produced the data to the left for this table (assuming 2000 1 68 F LO CW W Ca CA 9:35 AM A U ENG () 0 Cloudy 7/11/2024New Tab 9: New Tab Mathematical Model RASHEED BARASHEE X Meet -gks-yvwo O X . RASHEED BARASHEEL X G 25 docs.google.com/document/d/1rsq58LbKLUbB59uW80289JUq7xs-J37dukjz5wbrJHk/edit?pli=1 R . . . New Tab Qatar Ai... | dole bjbj. RASHEED BARASHEED - Mathematical Model Test Hudgin 2019 * & Share R File Edit View Insert Format Tools Extensions Help 90% . Normal text Calibri 11 + BIUA 31 IE 2 X b) Desmo produced the data to the left for this table (assuming 2000 V1 - mx, + b to be year 0). Write the following equations: C STATISTICS RESIDUALS N 2=1 1 plot Linear: r = 1 D. PARAMETERS 1 = 434.971 b = 6214 Exponential: 3 X x2 + bx, + c V1 - ax+ STATISTICS RESIDUALS Quadratic: N R= 1 ez plot PARAMETERS a = 0.006-42857 b = 434.945 c) Use the model you think is best to calculate the average amount = 6214.01 spent on utilities in 1995. + X M1-a(b) 1 Log Mode STATISTICS RESIDUALS R = 0.9987 es plot PARAMETERS a = 6242.62 b = 1 06326 1 68 F CR 9:35 AM Cloudy L W U ENG @ () 0 7/11/202423 docs.google.com/ R RASHEED BARASHEED - Mathematical Model Test Hudgin 2019 + o & 'm:; 5 K~ & share - File Edit View Insert Format Tools Extensions Help QA 6 & A F 90% -~ Normal text ~ Comic... * | '_1(} | +| B I U A 2 | e = v = Y- v = v = i 2 - ~ E: IS 100 OO L 0 O R o 0 L o o P MAP4C Unit 2 Test: Graphical Models Name: _ ; Expectations Ovwerall @ M2 condimo and algebr; For questions 1 4, choose the best answer. 2 1. Which model appears most suitable for the scatter plot? linear model quadratic model, leading to a maximum exponential model, leading to 38 minimum exponential model 3 an ow 1l [ Refer to the scatter plot in guestion 1. The rate of change of the relation is = a. constant and negative B b. increasing a <. constant and positive q d. decreasing quadratic model is the best fit for a set of data when a. first differences are b. second third ratios breaking news="@" am g o milder inflation... brg new tab mathematical rasheed barashee x meet . barasheel docs.google.com r qatar ai... dole bjbj. barasheed test hudgin share file edit view insert format tools extensions help normal text comic... ie which appears most appropriate in table d linear mode c. exponential c none these consider graph. parts shows multiple choice rate change negative zero e describe each trend using proper terminology. b w co cr u eng i m by : classify following as or other y="3x" cy="x" d.y="2.54(3)" an orange tossed straight up air. height what it released into air increasing more rapidly during after launch begins to fall explain why. time cw biua gap between lightning thunder occurs because sound travels slowly than light. this gives speed at various temperatures. temperature velocity create scatter plot data. determine equation line fit. does represent context predict temperatures ii use your calculate>
Step by Step Solution
There are 3 Steps involved in it

Get step-by-step solutions from verified subject matter experts