

Question: Next according to the graph, we must research, which year gdp falls & rise and why? What happened that year? Example, the recent year 2018
Next according to the graph, we must research, which year gdp falls & rise and why? What happened that year? Example, the recent year 2018 GDP graph went down, why, because covid, what happened that period, traveling restrictions, most of the Industry were facing lock down, restaurants were open wt limited hours, got so many. YEARS TO EXPLAIN- (1991-2006) 15 yearsCOUNTRY TO EXPLAIN- ( MALAYSIA)
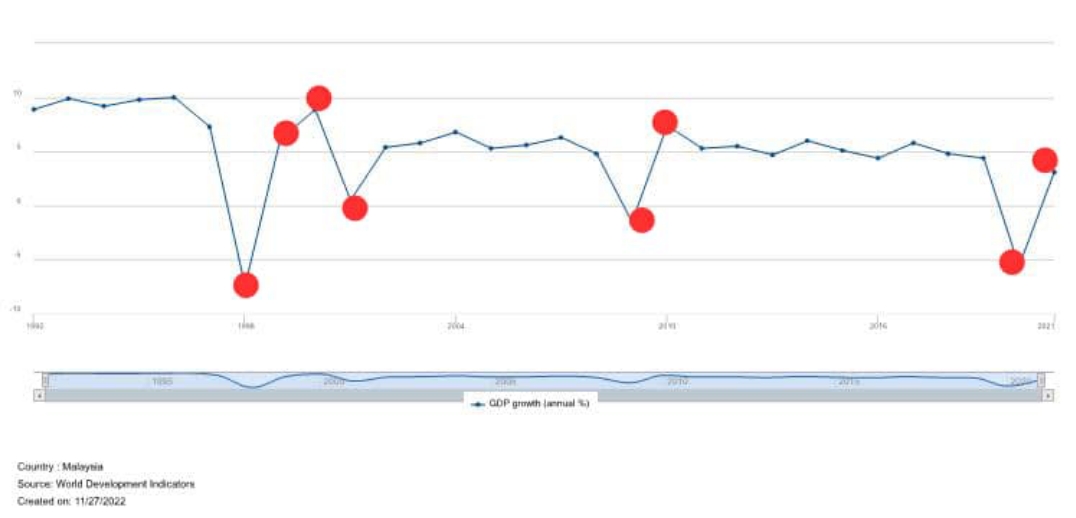
GDP growth jamaal ) Country ! Malaysia Source: World Development Indestory Created on 11/27/2022
Step by Step Solution
There are 3 Steps involved in it
1 Expert Approved Answer
Step: 1 Unlock

Question Has Been Solved by an Expert!
Get step-by-step solutions from verified subject matter experts
Step: 2 Unlock
Step: 3 Unlock