

Question: Next, in the RawData worksheet: enter the formulas to complete the two missing column entries (note: you must complete this step before proceeding to the
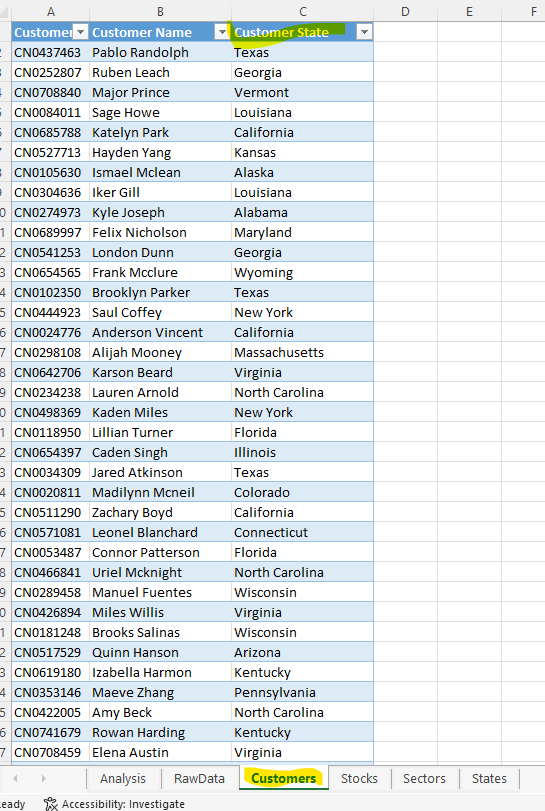
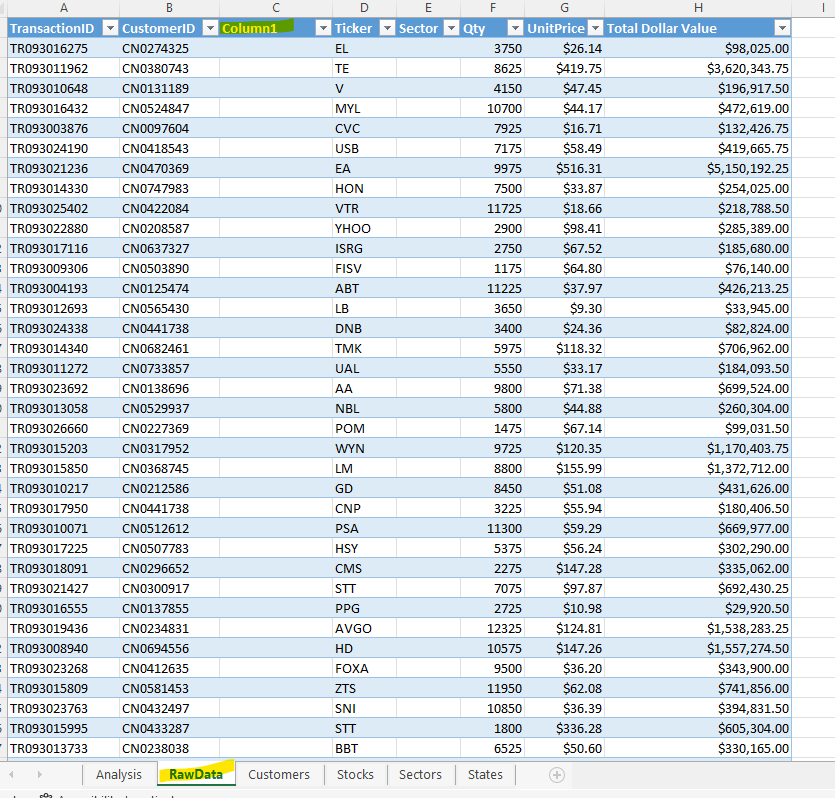
Next, in the RawData worksheet: enter the formulas to complete the two missing column entries (note: you must complete this step before proceeding to the creation of the pivot table). In the State column (column C), enter a VLOOKUP() function that will find the state each customer lives in (based on the CustomerID (column B) in the RawData worksheet) using the Customers worksheet, which contains each customers data (including IDs, names and states). In the Sector column (column E), enter a VLOOKUP() function to find the sector for each stock (based on the Ticker symbol (column D) in the RawData worksheet) using the Stocks worksheet, which contains each stocks data (including its ticker symbol, stock name and sector). Task 2(b): Copy and paste into your CA 3 report template document the following VLOOKUP formulas from the first cell in each column of the RawData worksheet for the following items: 2(b) State [RawData worksheet, Cell C2] (From the State column) 2(b) Sector [RawData worksheet, Cell E2] (From the Sector column) Note: row label filter and slicer locations redacted
eady R Accessibility: Investigate
Step by Step Solution
There are 3 Steps involved in it

Get step-by-step solutions from verified subject matter experts