

Next is to further explore the variables that are really contributing to the energy production from...
Fantastic news! We've Found the answer you've been seeking!
Question:

Transcribed Image Text:
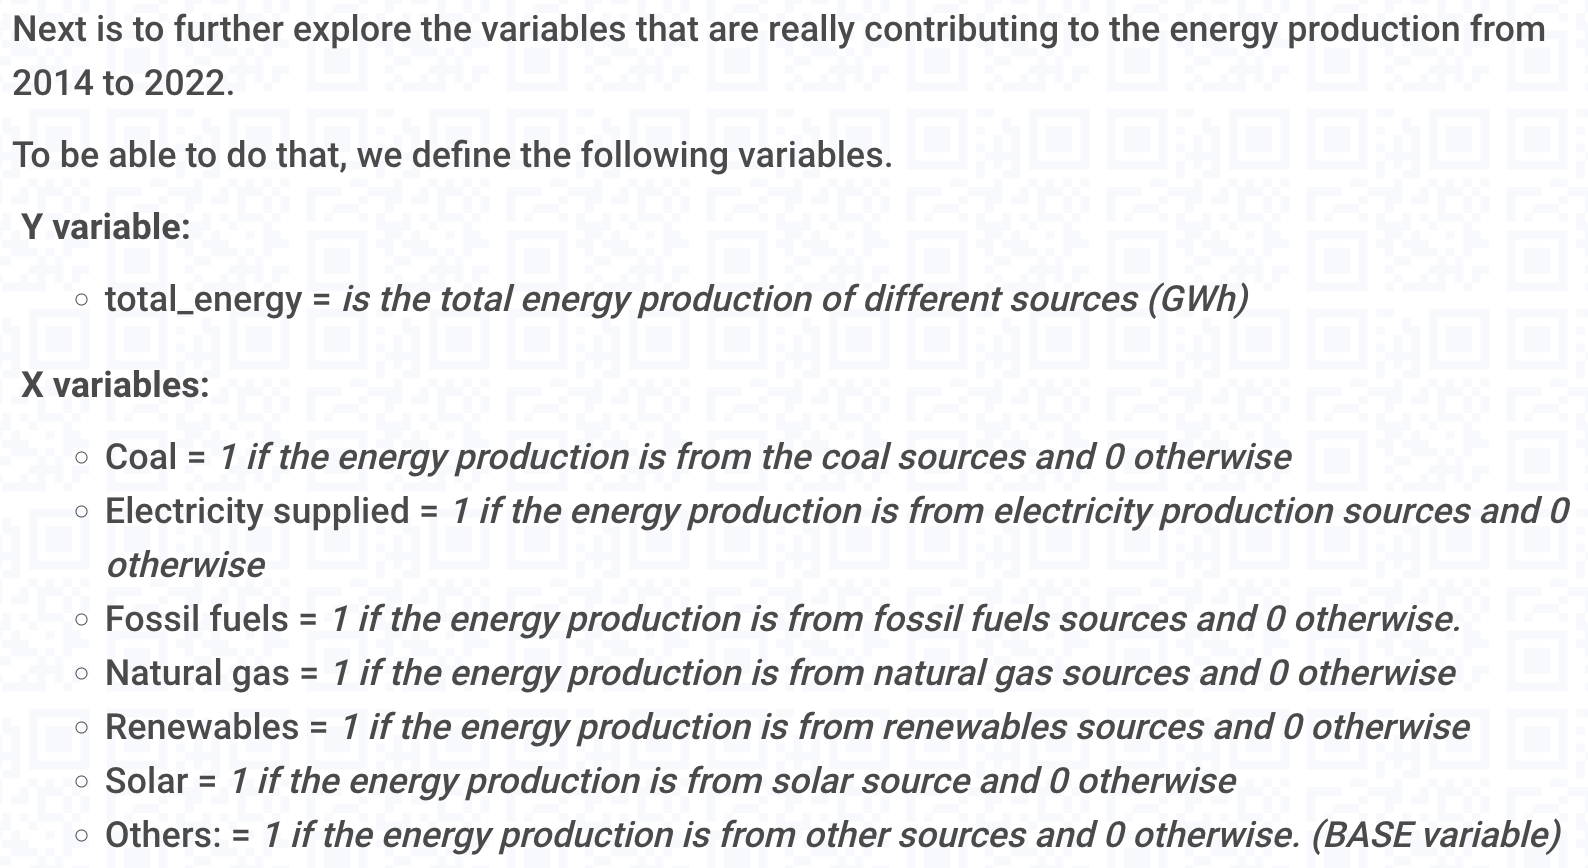
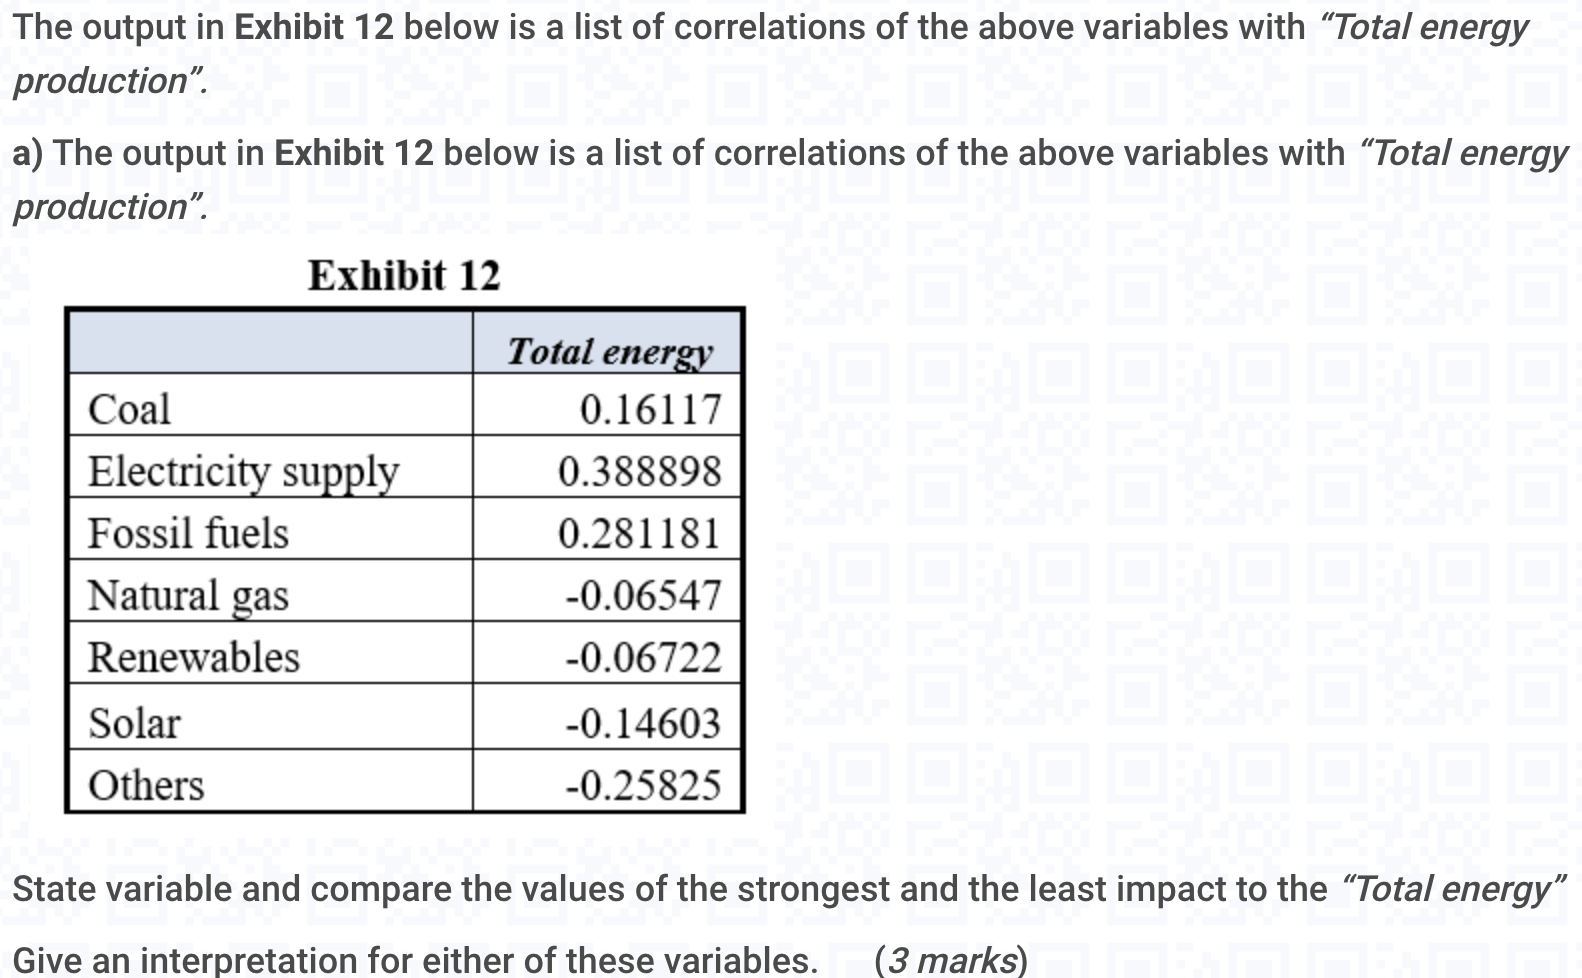
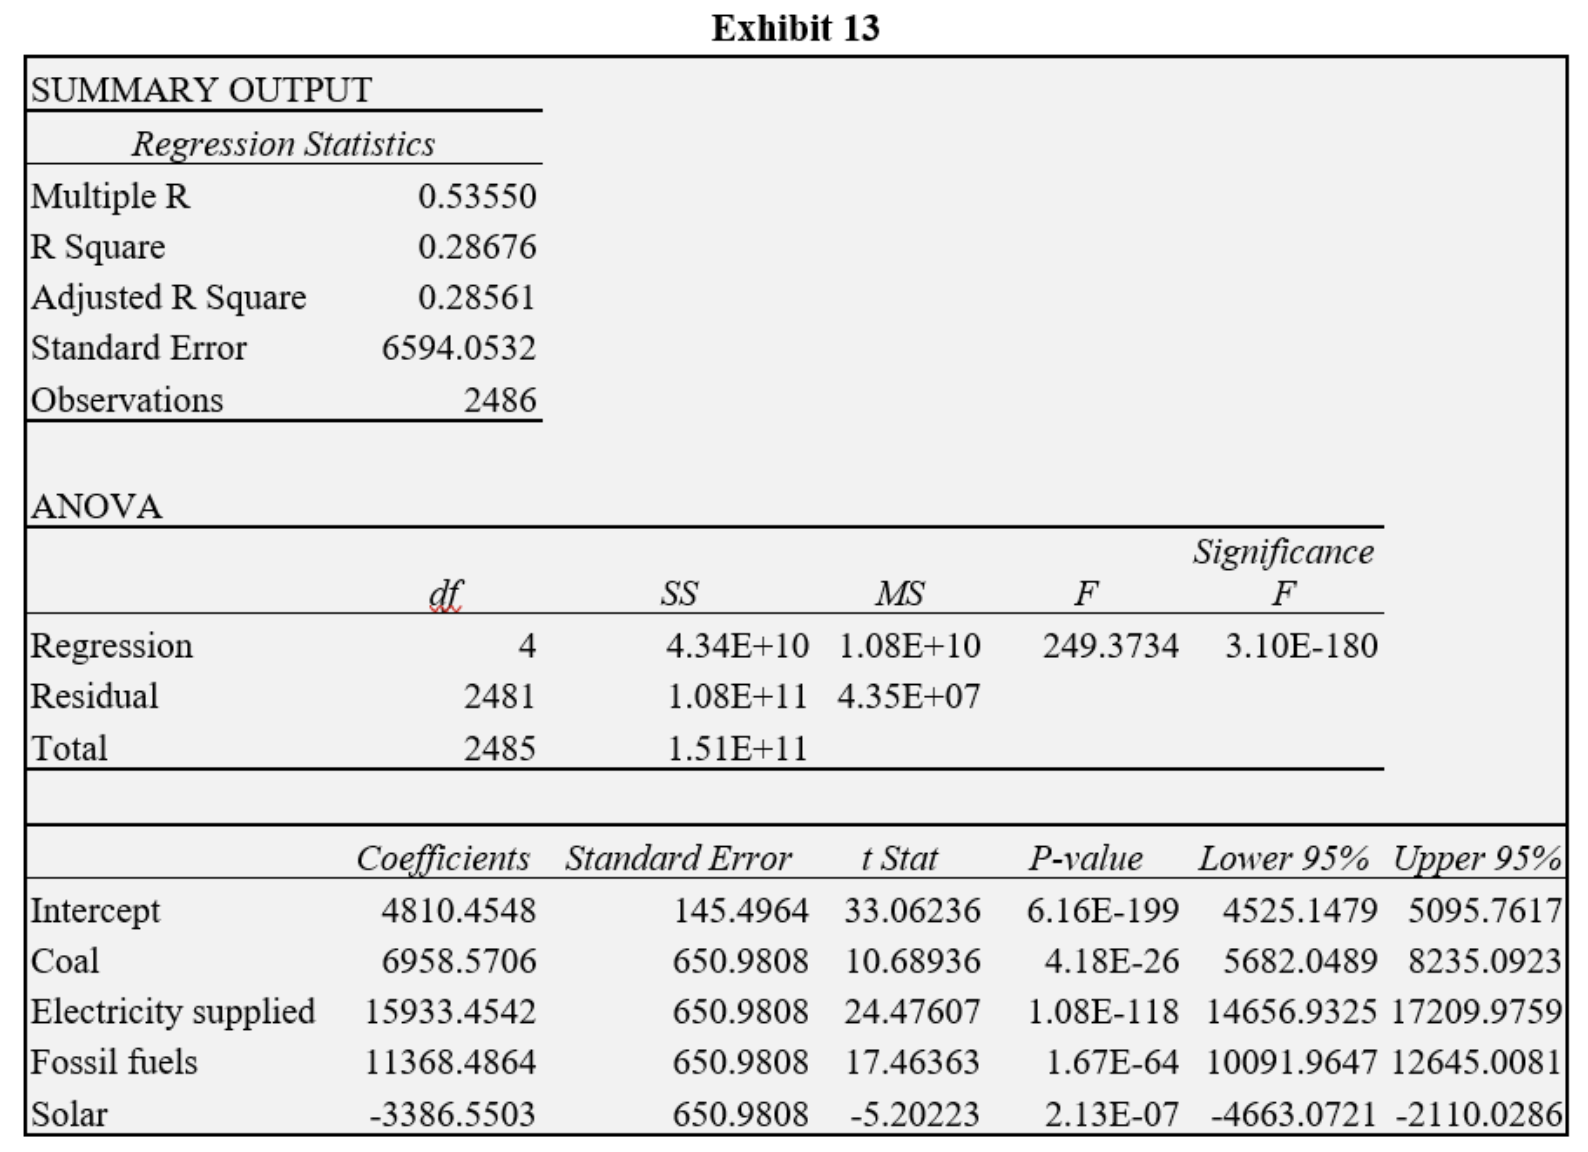
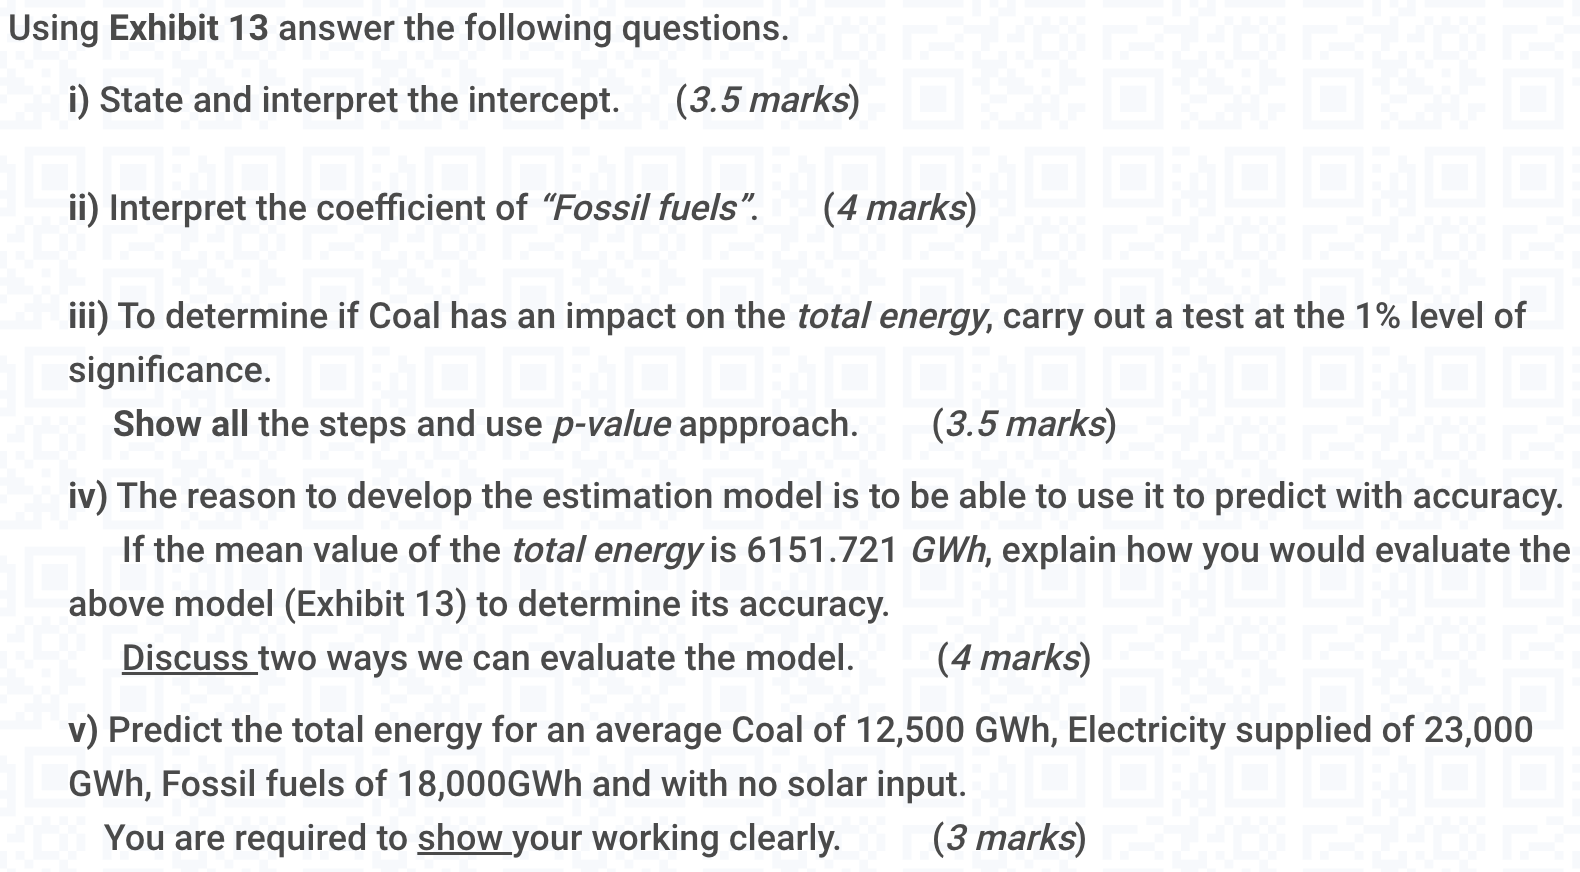
Next is to further explore the variables that are really contributing to the energy production from 2014 to 2022. To be able to do that, we define the following variables. Y variable: total_energy = is the total energy production of different sources (GWh) variable X variables: Coal = 1 if the energy production is from the coal sources and 0 otherwise Electricity supplied = 1 if the energy production is from electricity production sources and 0 otherwise O Fossil fuels = 1 if the energy production is from fossil fuels sources and 0 otherwise. o Natural gas = 1 if the energy production is from natural gas sources and 0 otherwise o Renewables = 1 if the energy production is from renewables sources and 0 otherwise Solar = 1 if the energy production is from solar source and 0 otherwise Others: = 1 if the energy production is from other sources and 0 otherwise. (BASE variable) The output in Exhibit 12 below is a list of correlations of the above variables with "Total energy production". a) The output in Exhibit 12 below is a list of correlations of the above variables with "Total energy production". SA Exhibit 12 Coal Electricity supply Fossil fuels Natural gas Renewables Solar Others Total energy 0.16117 0.388898 0.281181 -0.06547 -0.06722 -0.14603 -0.25825 State variable and compare the values of the strongest and the least impact to the "Total energy" Give an interpretation for either of these variables. (3 marks) b) The output in Exhibit 13 below is a regression of the total energy on the variables coal, electricity supplied, fossil fuels, solar as defined in above. The variable for "Others" is taken as the base in this regression.AT SUMMARY OUTPUT Regression Statistics Multiple R R Square Adjusted R Square Standard Error Observations ANOVA Regression Residual Total Intercept Coal Electricity supplied Fossil fuels Solar 0.53550 0.28676 0.28561 6594.0532 2486 df 4 2481 2485 SS Exhibit 13 MS 4.34E+10 1.08E+10 1.08E+11 4.35E+07 1.51E+11 Coefficients Standard Error t Stat 4810.4548 6958.5706 145.4964 33.06236 650.9808 10.68936 650.9808 24.47607 650.9808 17.46363 15933.4542 11368.4864 -3386.5503 650.9808 -5.20223 Significance F F 249.3734 3.10E-180 P-value Lower 95% Upper 95% 6.16E-199 4525.1479 5095.7617 4.18E-26 5682.0489 8235.0923 1.08E-118 14656.9325 17209.9759 1.67E-64 10091.9647 12645.0081 2.13E-07 -4663.0721 -2110.0286 Using Exhibit 13 answer the following questions. i) State and interpret the intercept. (3.5 marks) ii) Interpret the coefficient of "Fossil fuels". (4 marks) 16 iii) To determine if Coal has an impact on the total energy, carry out a test at the 1% level of significance.DXD DAD DADO Show all the steps and use p-value appproach. (3.5 marks) iv) The reason to develop the estimation model is to be able to use it to predict with accuracy. If the mean value of the total energy is 6151.721 GWh, explain how you would evaluate the abo above model (Exhibit 13) to determine its accuracy. Discuss two ways we can evaluate the model. (4 marks) v) Predict the total energy for an average Coal of 12,500 GWh, Electricity supplied of 23,000 GWh, Fossil fuels of 18,000GWh and with no solar input. You are required to show your working clearly. (3 marks) O Next is to further explore the variables that are really contributing to the energy production from 2014 to 2022. To be able to do that, we define the following variables. Y variable: total_energy = is the total energy production of different sources (GWh) variable X variables: Coal = 1 if the energy production is from the coal sources and 0 otherwise Electricity supplied = 1 if the energy production is from electricity production sources and 0 otherwise O Fossil fuels = 1 if the energy production is from fossil fuels sources and 0 otherwise. o Natural gas = 1 if the energy production is from natural gas sources and 0 otherwise o Renewables = 1 if the energy production is from renewables sources and 0 otherwise Solar = 1 if the energy production is from solar source and 0 otherwise Others: = 1 if the energy production is from other sources and 0 otherwise. (BASE variable) Next is to further explore the variables that are really contributing to the energy production from 2014 to 2022. To be able to do that, we define the following variables. Y variable: total_energy = is the total energy production of different sources (GWh) variable X variables: Coal = 1 if the energy production is from the coal sources and 0 otherwise Electricity supplied = 1 if the energy production is from electricity production sources and 0 otherwise O Fossil fuels = 1 if the energy production is from fossil fuels sources and 0 otherwise. o Natural gas = 1 if the energy production is from natural gas sources and 0 otherwise o Renewables = 1 if the energy production is from renewables sources and 0 otherwise Solar = 1 if the energy production is from solar source and 0 otherwise Others: = 1 if the energy production is from other sources and 0 otherwise. (BASE variable) The output in Exhibit 12 below is a list of correlations of the above variables with "Total energy production". a) The output in Exhibit 12 below is a list of correlations of the above variables with "Total energy production". SA Exhibit 12 Coal Electricity supply Fossil fuels Natural gas Renewables Solar Others Total energy 0.16117 0.388898 0.281181 -0.06547 -0.06722 -0.14603 -0.25825 State variable and compare the values of the strongest and the least impact to the "Total energy" Give an interpretation for either of these variables. (3 marks) The output in Exhibit 12 below is a list of correlations of the above variables with "Total energy production". a) The output in Exhibit 12 below is a list of correlations of the above variables with "Total energy production". SA Exhibit 12 Coal Electricity supply Fossil fuels Natural gas Renewables Solar Others Total energy 0.16117 0.388898 0.281181 -0.06547 -0.06722 -0.14603 -0.25825 State variable and compare the values of the strongest and the least impact to the "Total energy" Give an interpretation for either of these variables. (3 marks) b) The output in Exhibit 13 below is a regression of the total energy on the variables coal, electricity supplied, fossil fuels, solar as defined in above. The variable for "Others" is taken as the base in this regression.AT b) The output in Exhibit 13 below is a regression of the total energy on the variables coal, electricity supplied, fossil fuels, solar as defined in above. The variable for "Others" is taken as the base in this regression.AT SUMMARY OUTPUT Regression Statistics Multiple R R Square Adjusted R Square Standard Error Observations ANOVA Regression Residual Total Intercept Coal Electricity supplied Fossil fuels Solar 0.53550 0.28676 0.28561 6594.0532 2486 df 4 2481 2485 SS Exhibit 13 MS 4.34E+10 1.08E+10 1.08E+11 4.35E+07 1.51E+11 Coefficients Standard Error t Stat 4810.4548 6958.5706 145.4964 33.06236 650.9808 10.68936 650.9808 24.47607 650.9808 17.46363 15933.4542 11368.4864 -3386.5503 650.9808 -5.20223 Significance F F 249.3734 3.10E-180 P-value Lower 95% Upper 95% 6.16E-199 4525.1479 5095.7617 4.18E-26 5682.0489 8235.0923 1.08E-118 14656.9325 17209.9759 1.67E-64 10091.9647 12645.0081 2.13E-07 -4663.0721 -2110.0286 SUMMARY OUTPUT Regression Statistics Multiple R R Square Adjusted R Square Standard Error Observations ANOVA Regression Residual Total Intercept Coal Electricity supplied Fossil fuels Solar 0.53550 0.28676 0.28561 6594.0532 2486 df 4 2481 2485 SS Exhibit 13 MS 4.34E+10 1.08E+10 1.08E+11 4.35E+07 1.51E+11 Coefficients Standard Error t Stat 4810.4548 6958.5706 145.4964 33.06236 650.9808 10.68936 650.9808 24.47607 650.9808 17.46363 15933.4542 11368.4864 -3386.5503 650.9808 -5.20223 Significance F F 249.3734 3.10E-180 P-value Lower 95% Upper 95% 6.16E-199 4525.1479 5095.7617 4.18E-26 5682.0489 8235.0923 1.08E-118 14656.9325 17209.9759 1.67E-64 10091.9647 12645.0081 2.13E-07 -4663.0721 -2110.0286 Using Exhibit 13 answer the following questions. i) State and interpret the intercept. (3.5 marks) ii) Interpret the coefficient of "Fossil fuels". (4 marks) 16 iii) To determine if Coal has an impact on the total energy, carry out a test at the 1% level of significance.DXD DAD DADO Show all the steps and use p-value appproach. (3.5 marks) iv) The reason to develop the estimation model is to be able to use it to predict with accuracy. If the mean value of the total energy is 6151.721 GWh, explain how you would evaluate the abo above model (Exhibit 13) to determine its accuracy. Discuss two ways we can evaluate the model. (4 marks) v) Predict the total energy for an average Coal of 12,500 GWh, Electricity supplied of 23,000 GWh, Fossil fuels of 18,000GWh and with no solar input. You are required to show your working clearly. (3 marks) O Using Exhibit 13 answer the following questions. i) State and interpret the intercept. (3.5 marks) ii) Interpret the coefficient of "Fossil fuels". (4 marks) 16 iii) To determine if Coal has an impact on the total energy, carry out a test at the 1% level of significance.DXD DAD DADO Show all the steps and use p-value appproach. (3.5 marks) iv) The reason to develop the estimation model is to be able to use it to predict with accuracy. If the mean value of the total energy is 6151.721 GWh, explain how you would evaluate the abo above model (Exhibit 13) to determine its accuracy. Discuss two ways we can evaluate the model. (4 marks) v) Predict the total energy for an average Coal of 12,500 GWh, Electricity supplied of 23,000 GWh, Fossil fuels of 18,000GWh and with no solar input. You are required to show your working clearly. (3 marks) O
Expert Answer:
Answer rating: 100% (QA)
Analysis of Energy Production Data a Correlation Analysis Exhibit 12 Strongest Impact Electricity Supplied 03889 This indicates a positive and moderate correlation suggesting electricity supplied cont... View the full answer

Related Book For 

Posted Date:
Students also viewed these accounting questions
-
< 11:58 6:29 You 4 Photos perspective. 5G 40 6:34 pm evaluation courses.ecu.edu.au 5G 394 Assessment Task 3: Presentation A 6-8 minute presentation video comprising 20% of the Unit assessment. Value:...
-
This is a research study, having four variables. .1)Leader humility 2)Antisocial behavior 3)mindfulness 4) Self-efficacy I need help to w.rite Abstract of this study and need you to make the sense...
-
Starting in the 1990s, the U.S. electric utility sector underwent a process of consolidation. Utility companies merged, acquired other utilities, and moved from their home bases in one state across...
-
A business had always made an allowance for doubtful debts at the rate of 2 per cent of accounts receivable. On 1 January 2011 the amount for this, brought forward from the previous year, was 300....
-
Draw the form in which each of the following amino acids predominantly exists at physiological pH (7.3): a. Histidine b. Glutamine c. Lysine d. Arginine e. Tyrosine
-
Experiments have higher internal validity than quasi-experiments because they ______. Question 12 options: utilize random assignment to IV conditions utilize already existing groups include an IV...
-
Wayflaire Inc. produces home products. The cost to manufacture a case ( 36 sets) of its most popular set of casual dinnerware is as follows: The average sales price for a case of dinnerware is \(\$...
-
At December 31, 2014, the trial balance of Mariette Company contained the following amounts before adjustment. Instructions (a) Prepare the adjusting entry at December 31, 2014, to record bad debt...
-
3. How does the cash flow statement classify cash receipts and cash payments? List and describe the three categories: 3. How does the cash flow statement classify cash receipts and cash payments?...
-
1. Which process should VBB choose to produce?? 2. How much would VBP be willing to pay for the testing that is currently offered, for each batch?? 3. Would we be considered a perfect test, at twice...
-
How do changes in the exchange rate between two countries impact the balance of trade and the overall level of economic activity in each country?
-
What are the differences among ROI analysis,Break Even analysis,and NPV analysis?Which one is more suitable under what situation? Please would you provide an example of capacity decisions and how to...
-
What innovative methodologies can leaders employ to cultivate a diverse and inclusive workforce, thereby capitalizing on the manifold perspectives and experiences to foster creativity and drive...
-
Platinum, Co. is generating a balance sheet for year end Dec 31, Y1. Sales are $50300. Cash is $15350. Accounts Recievable is $21550. Inventory is $43500. The Allowance for Doubtful Accounts is...
-
Javier is self-employed. In 2022, he earned income of $5,500 from one firm, reported to him on a Form 1099-NEC, and income of $4,000 from another firm, also reported to him on a Form 1099-NEC. In...
-
Disney has assets worth $250.378 billion. It has debt with a total face value of $38.057 billion. If the risk-free interest rate is 0.375% per annum and the standard deviation of monthly returns on...
-
1 ) Find the amount of compression occurring in the spring in horizontal equilibrium position. 2 ) Find out with what angular frequency the plank will make simple harmonic motion.
-
In Exercises delete part of the domain so that the function that remains is one-to-one. Find the inverse function of the remaining function and give the domain of the inverse function. f(x) = 16x4 -3...
-
In addition to motivation what other topic(s) studied in organisational behaviour do you think has a significant relationship with stress at work?
-
To what extent do you accept the view that conflict is an inevitable feature of management and organisational behaviour?
-
Discuss those factors which affect selection and attention in the process of perception. Give examples of how perceptual selectivity is the source of organisational problems.
-
Rose Ubens, buys and sells goods. Her trial balance is presented below. Note: 1. Closing inventory is 4,000 Required: Prepare Rose Ubens, income statement for the year ended 31 December 2012 and a...
-
Paul Icasso has the following trial balance. Required: Prepare Paul Icassos trading and income statement for the year ended 31 March 2013 and a statement of financial position as at 31 March 2013. P....
-
Michael Anet has the following trial balance. Required: Prepare Michael Anets income statement for the year ended 31 December 2012 and statement of financial position as at 31 December 2012. M. Anet...

Study smarter with the SolutionInn App