

Question: Next Several Questions refer to the following SAME paragraph: Consider the below data showing demand for gallons of icecream at a popular retail chain, over
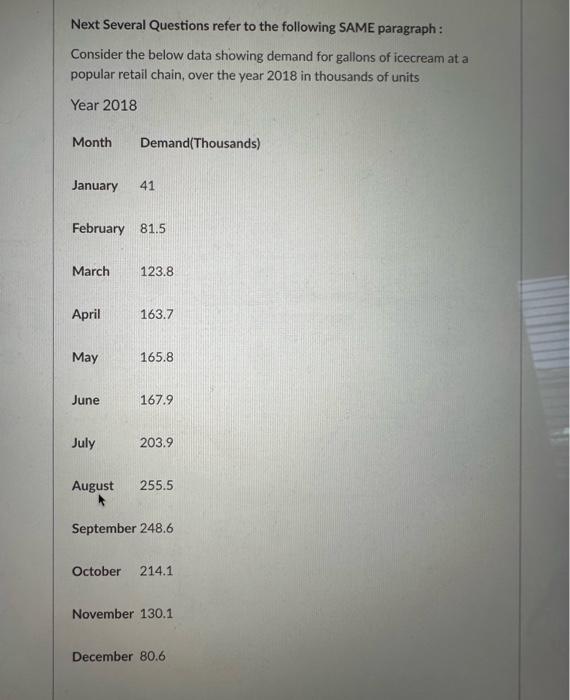
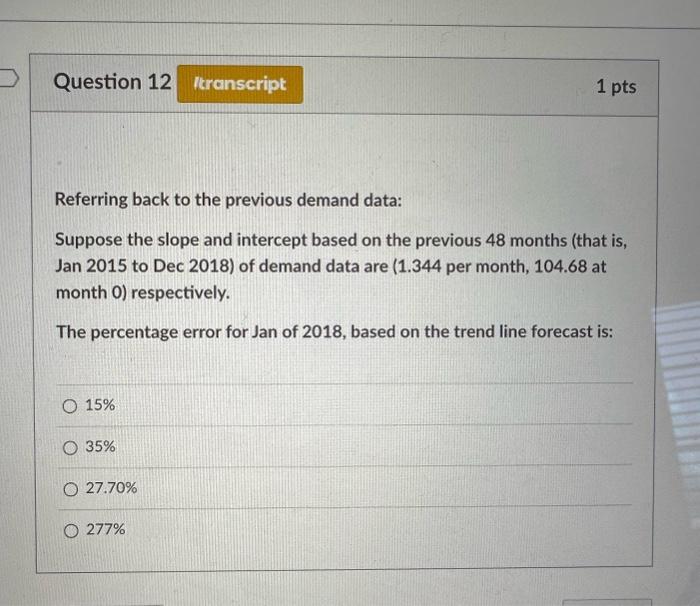
Next Several Questions refer to the following SAME paragraph: Consider the below data showing demand for gallons of icecream at a popular retail chain, over the year 2018 in thousands of units Year 2018 Month Demand(Thousands) January 41 February 81.5 March 123.8 April 163.7 May 165.8 June 167.9 July 203.9 August 255.5 September 248.6 October 214.1 November 130.1 December 80.6 Referring back to the previous demand data: Suppose the slope and intercept based on the previous 48 months (that is, Jan 2015 to Dec 2018) of demand data are (1.344 per month, 104.68 at month 0) respectively. The percentage error for Jan of 2018 , based on the trend line forecast is: 15% 35% 27.70% 277%
Step by Step Solution
There are 3 Steps involved in it

Get step-by-step solutions from verified subject matter experts