

Question: ng statements is correct? Paired Samples Statistics Moan N Sid. Deviation Sid. Error Mean Pair 1 I am confident I can learn 1.8673 1176 90637
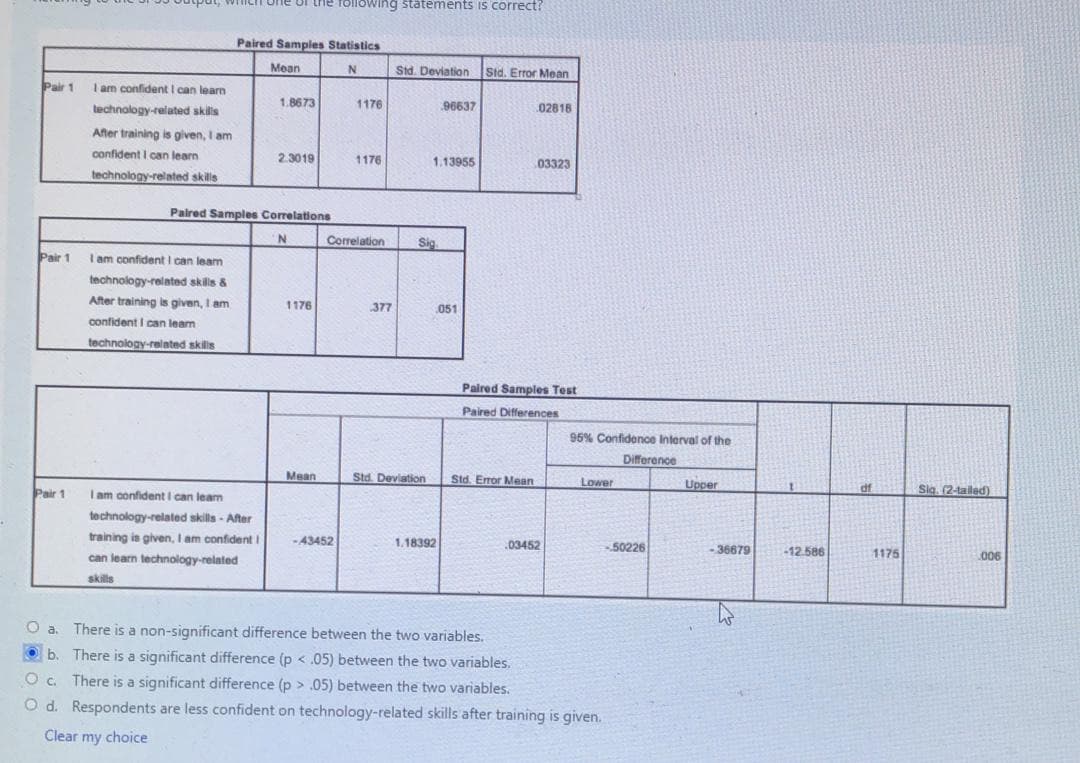
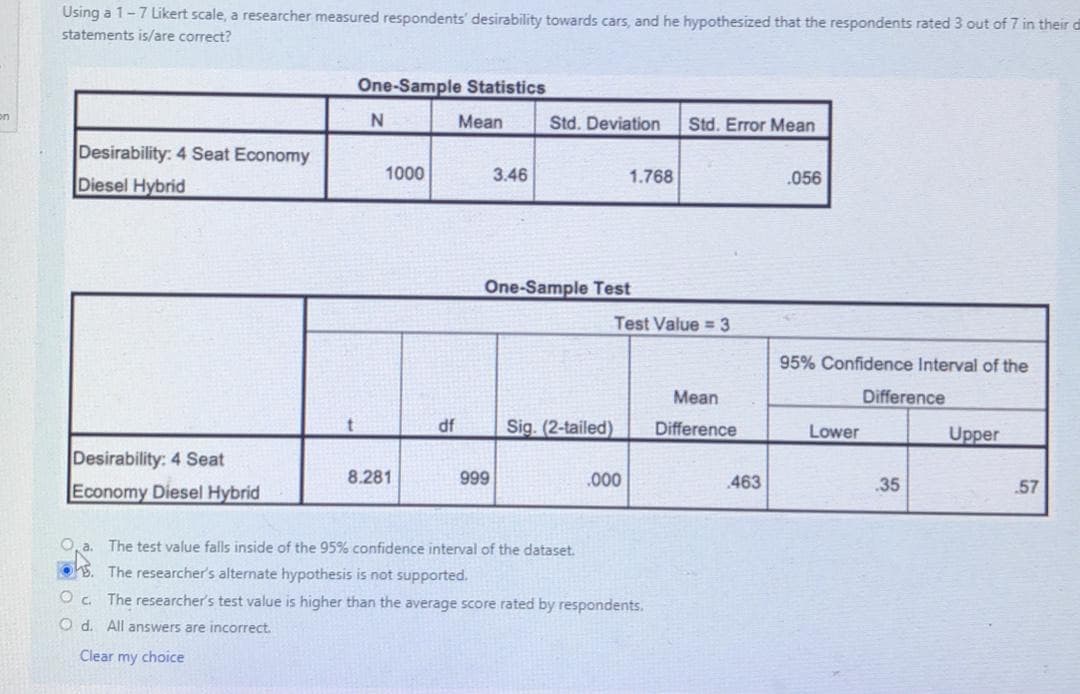
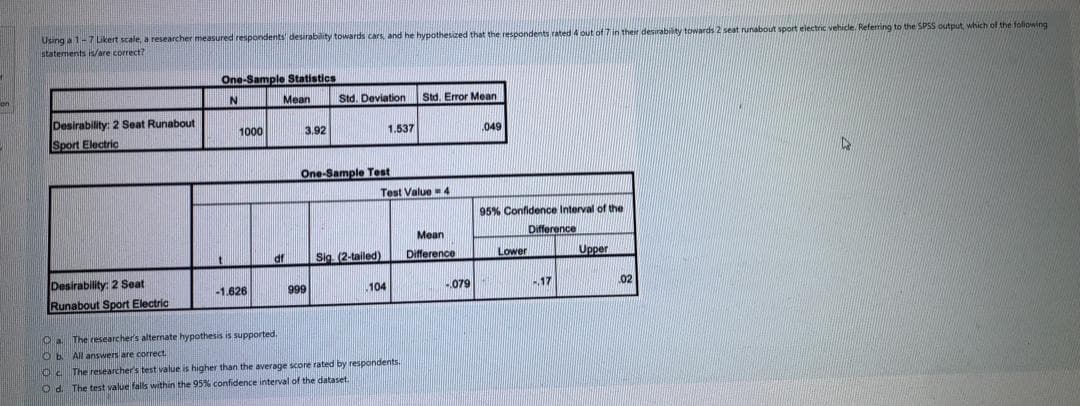
ng statements is correct? Paired Samples Statistics Moan N Sid. Deviation Sid. Error Mean Pair 1 I am confident I can learn 1.8673 1176 90637 02818 technology-related skills After training is given, I am confident I can learn 2 3019 1176 1.13955 03323 technology-related skills Paired Samples Correlations Correlation Sig. Pair 1 I am confident I can leam technology-related skills & After training is given, I am 1 176 377 051 confident I can learn technology-related skills Paired Samples Test Paired Differences 95% Confidence Interval of the Difference Mean Sid. Deviation Sid. Error Mean Lower Upper Sig. (2-talled) Pair 1 I am confident I can learn technology-related skills . After training is given, I am confident I - 43452 1.18392 03452 -50226 - 36679 -12 586 1176 1006 can learn technology-related skills O a. There is a non-significant difference between the two variables. b. There is a significant difference (p .05) between the two variables. O d. Respondents are less confident on technology-related skills after training is given. Clear my choiceUsing a 1 - 7 Likert scale, a researcher measured respondents' desirability towards cars, and he hypothesized that the respondents rated 3 out of 7 in their statements is/are correct? One-Sample Statistics N Mean Std. Deviation Std. Error Mean Desirability: 4 Seat Economy 1000 3.46 1.768 .056 Diesel Hybrid One-Sample Test Test Value = 3 95% Confidence Interval of the Mean Difference df Sig. (2-tailed) Difference Lower Upper Desirability: 4 Seat 8.281 999 .000 463 35 57 Economy Diesel Hybrid O, a. The test value falls inside of the 95% confidence interval of the dataset. OFB. The researcher's alternate hypothesis is not supported. c. The researcher's test value is higher than the average score rated by respondents. O d. All answers are incorrect. Clear my choiceUsing a 1- 7 Likert scale, a researcher measured respondents desirability towards cars, and he hypothesized that the statements W/are correct? in then desirability towa ig to the SPSS output, which of the following One-Sample Statistics N Mean Std. Deviation Sid. Error Mean Desirability: 2 Seat Runabout 1000 Sport Electric 3,92 1.537 .049 One-Sample Test Test Value - 4 95% Confidence Interval of the Mean Difference ar Sig (2-talled) Difference Lower Upper Desirability: 2 Seat -1.626 999 .104 4079 -.17 02 Runabout Sport Electric The researcher's alternate hypothesis is supported All answers are correct c. The researcher's test value is higher than the average score rated by respondents. O d. The test value falls within the 95%% confidence interval of the dataset
Step by Step Solution
There are 3 Steps involved in it

Get step-by-step solutions from verified subject matter experts