

Question: ng.cengage.com C Content Mind Tap - Cengage Learning CENGAGE MINDTAP Q Search this course ? Homework (Ch 10) X 3. The effect of negative externalities
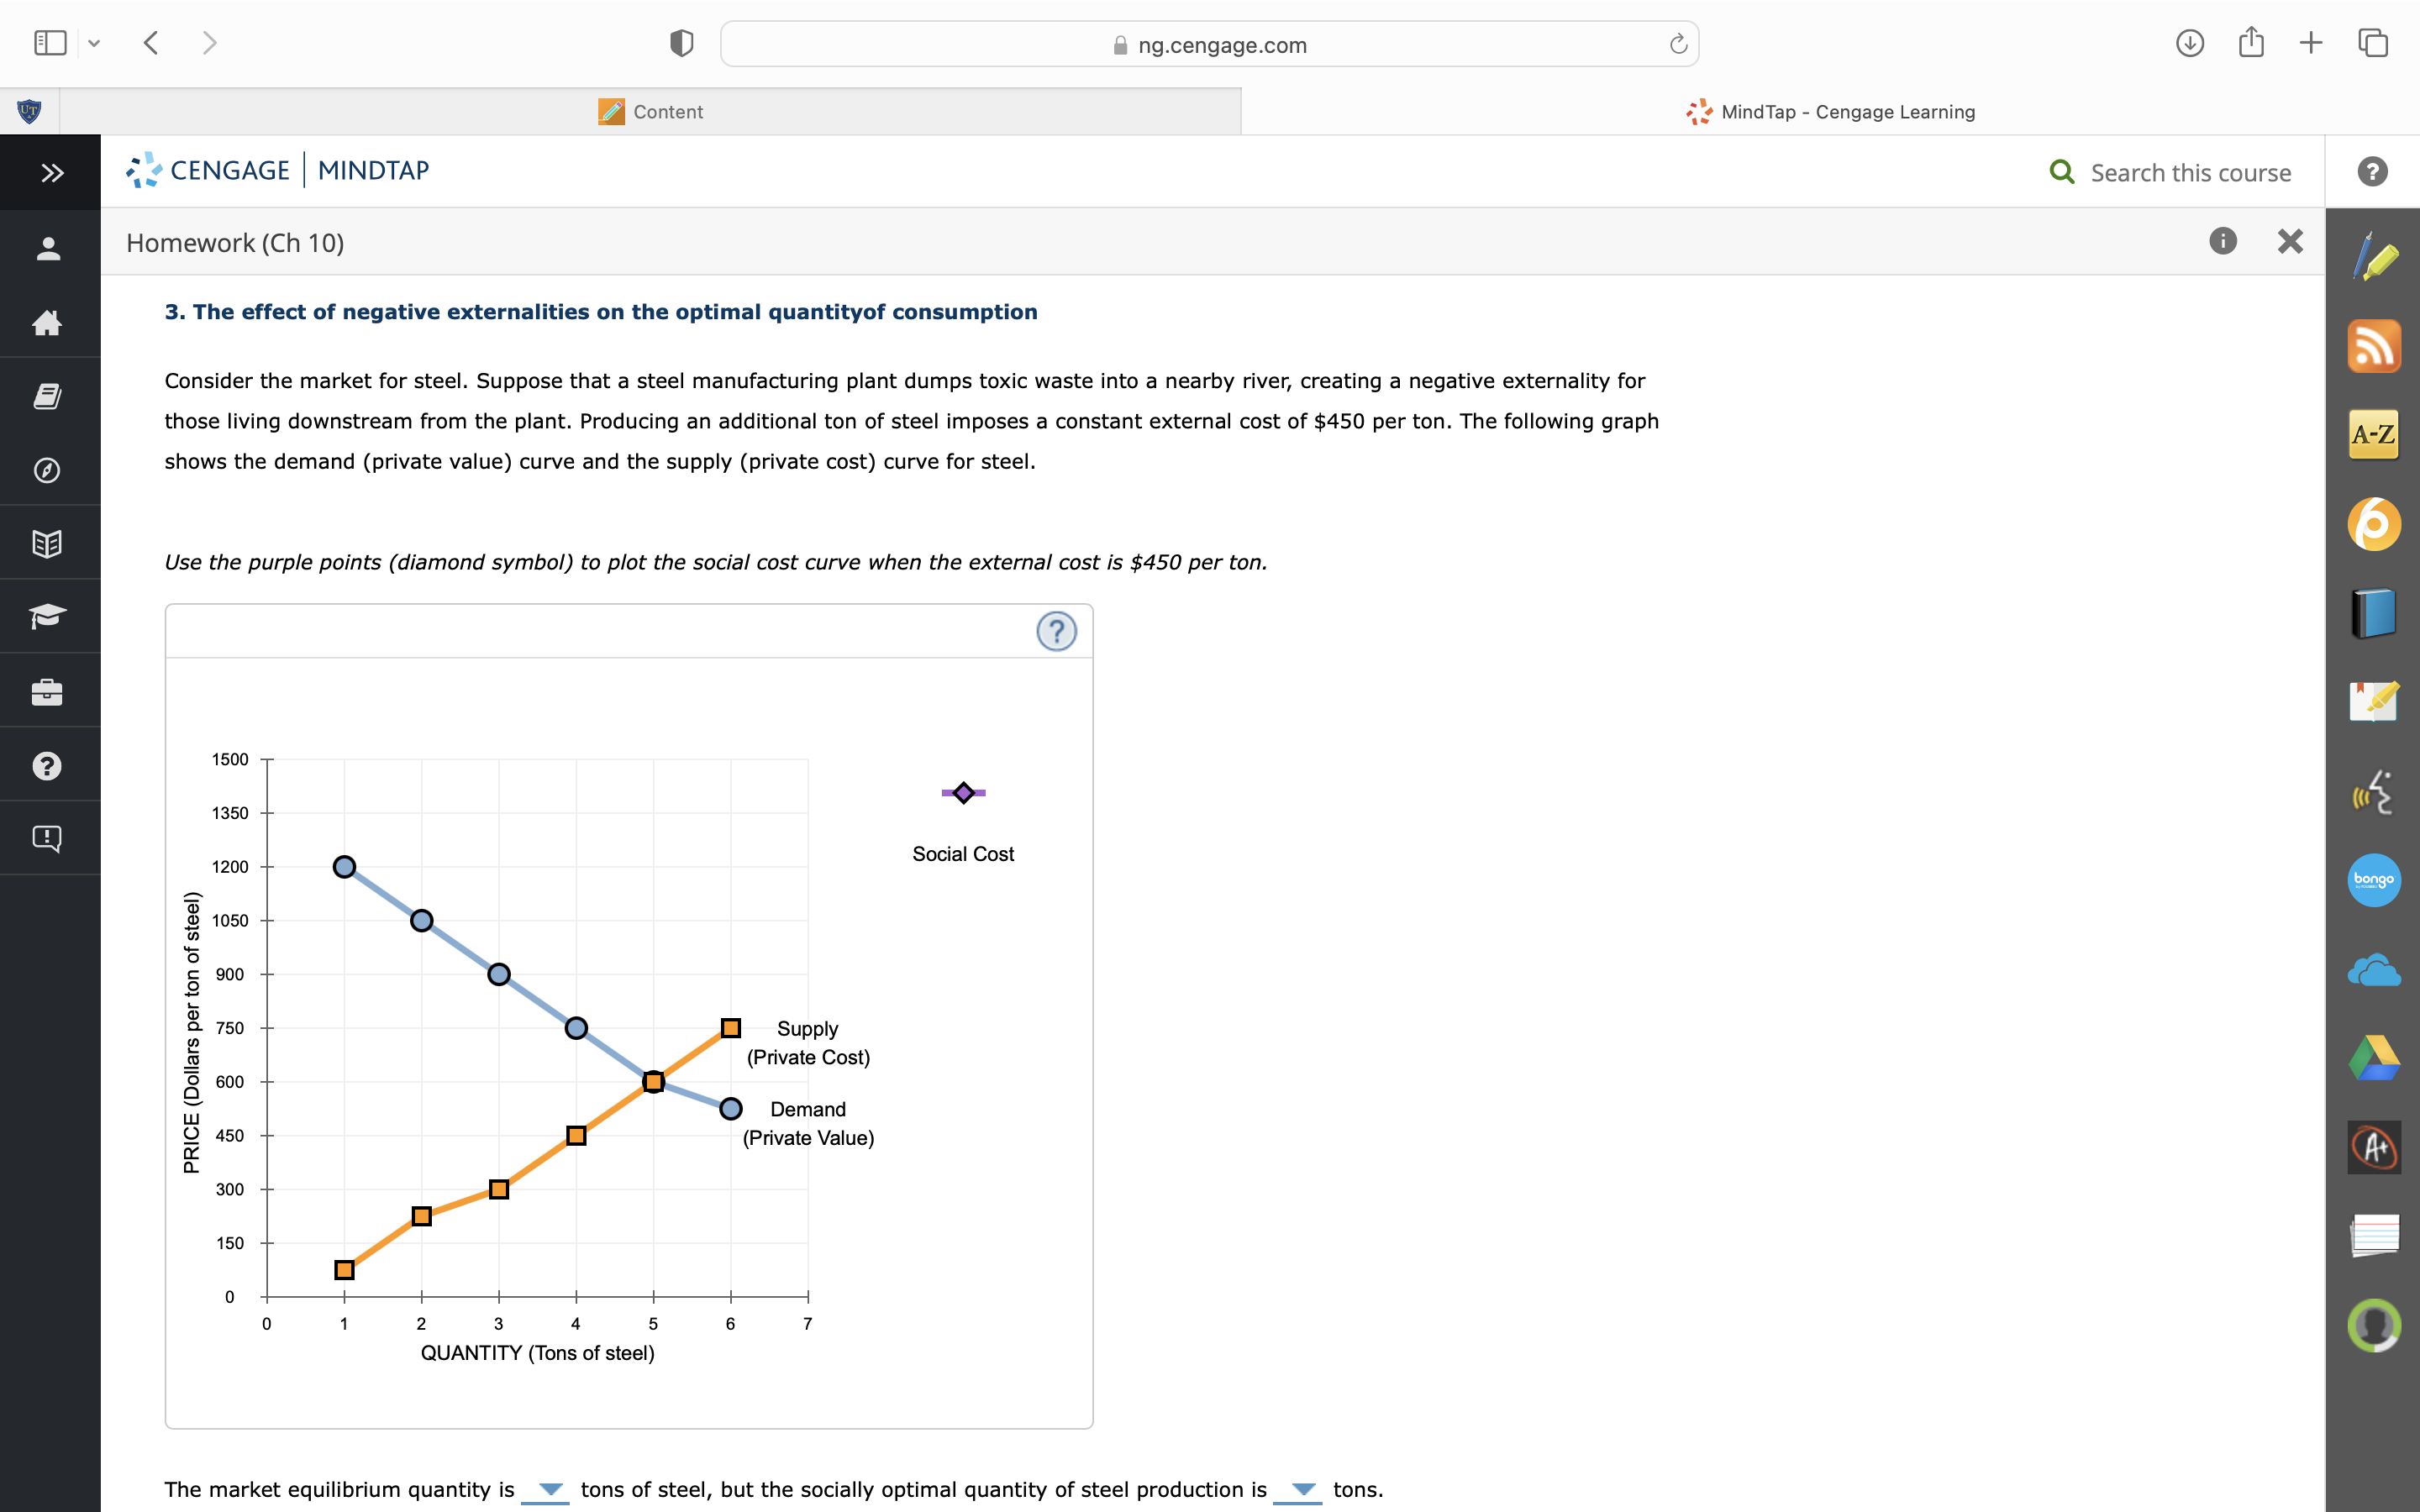


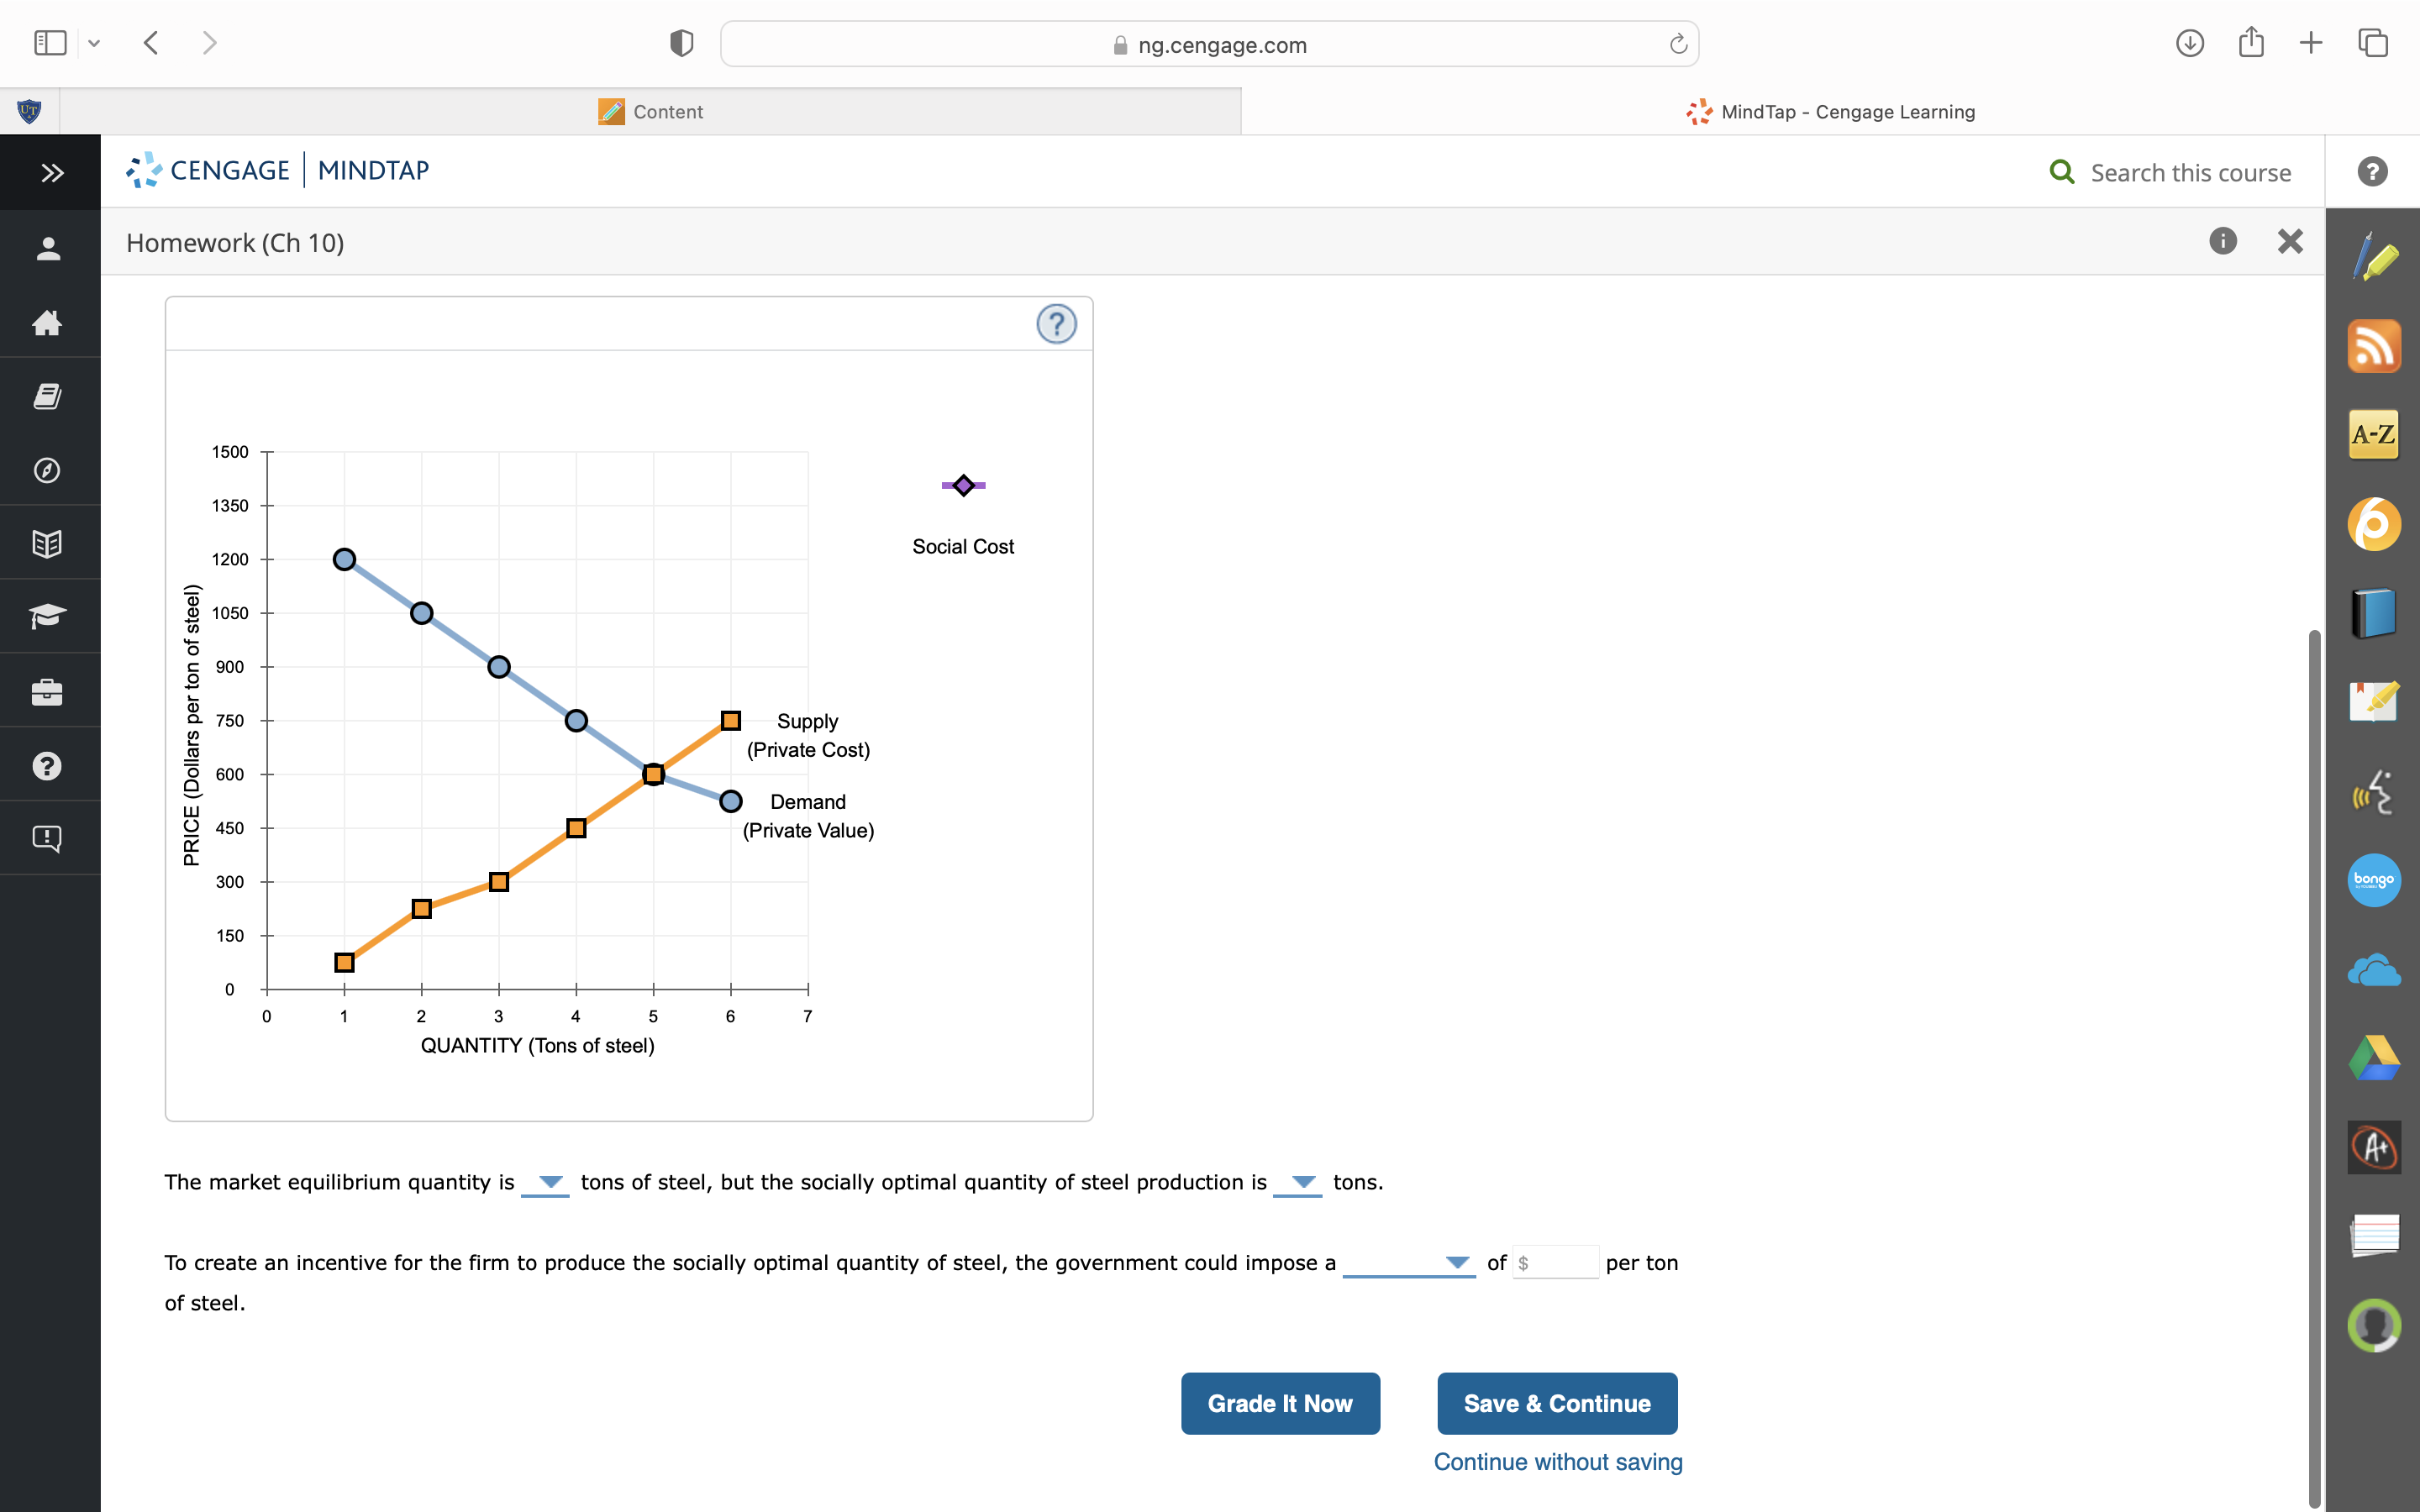
ng.cengage.com C Content Mind Tap - Cengage Learning CENGAGE MINDTAP Q Search this course ? Homework (Ch 10) X 3. The effect of negative externalities on the optimal quantityof consumption Consider the market for steel. Suppose that a steel manufacturing plant dumps toxic waste into a nearby river, creating a negative externality for those living downstream from the plant. Producing an additional ton of steel imposes a constant external cost of $450 per ton. The following graph A-Z shows the demand (private value) curve and the supply (private cost) curve for steel. Use the purple points (diamond symbol) to plot the social cost curve when the external cost is $450 per ton. (?) ? 1500 1350 Social Cost 1200 O bongo 1050 O 900 PRICE (Dollars per ton of steel) 750 Supply (Private Cost) 600 O Demand 450 Private Value) A+ 0 150 2 3 6 QUANTITY (Tons of steel) The market equilibrium quantity is tons of steel, but the socially optimal quantity of steel production is _ tons.ng.cengage.com C Content Mind Tap - Cengage Learning CENGAGE MINDTAP Q Search this course ? Homework (Ch 10) X A-Z 1500 1350 Social Cost 1200 O 1050 O 900 PRICE (Dollars per ton of steel) 750 Supply (Private Cost) ? 600 Demand 450 (Private Value) 300 0 bongo 150 2 3 6 QUANTITY (Tons of steel) A+ The market equilibrium quantity is tons of steel, but the socially optimal quantity of steel production is tons. To create an incentive for the firm to produce the socially optimal quantity of steel, the government could impose a of $ per ton of steel. O Grade It Now Save & Continue Continue without saving
Step by Step Solution
There are 3 Steps involved in it

Get step-by-step solutions from verified subject matter experts