

In April 1990, Nissan's Infiniti division planned to introduce the G20 in the United States, adding...
Fantastic news! We've Found the answer you've been seeking!
Question:
Transcribed Image Text:
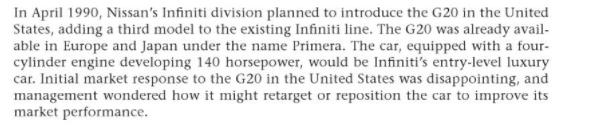
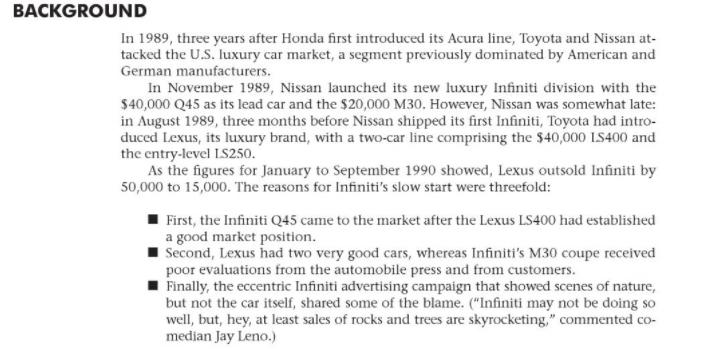
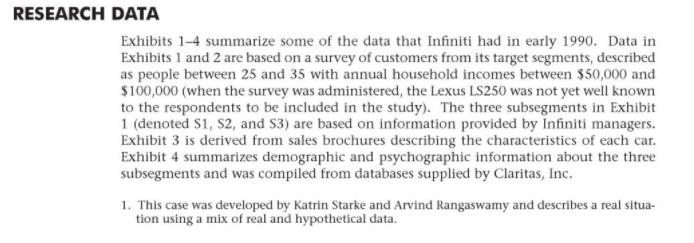
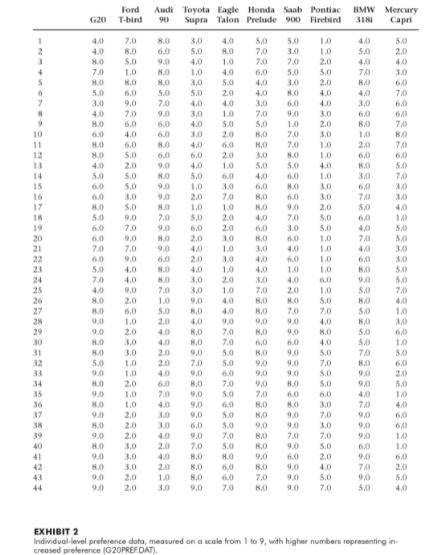
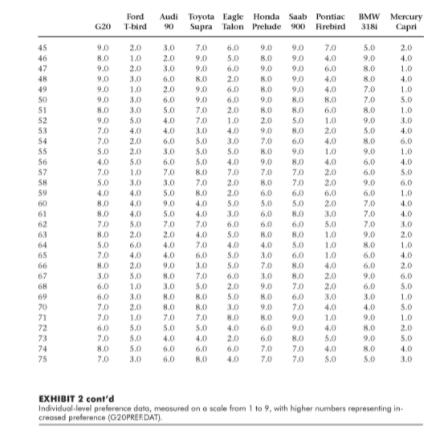
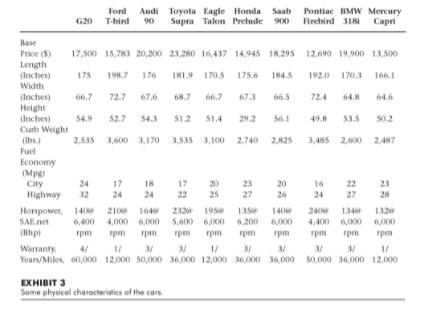
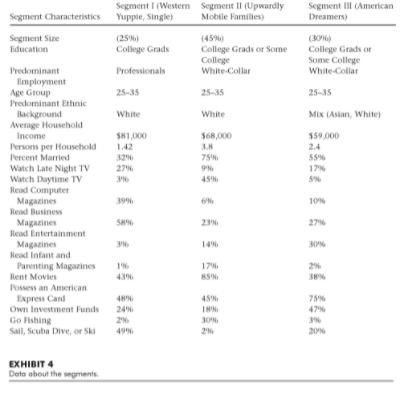
In April 1990, Nissan's Infiniti division planned to introduce the G20 in the United States, adding a third model to the existing Infiniti line. The G20 was already avail- able in Europe and Japan under the name Primera. The car, equipped with a four- cylinder engine developing 140 horsepower, would be Infiniti's entry-level luxury car. Initial market response to the G20 in the United States was disappointing, and management wondered how it might retarget or reposition the car to improve its market performance. BACKGROUND In 1989, three years after Honda first introduced its Acura line, Toyota and Nissan at- tacked the U.S. luxury car market, a segment previously dominated by American and German manufacturers. In November 1989, Nissan launched its new luxury Infiniti division with the $40,000 Q45 as its lead car and the $20,000 M30. However, Nissan was somewhat late: in August 1989, three months before Nissan shipped its first Infiniti, Toyota had intro- duced Lexus, its luxury brand, with a two-car line comprising the $40,000 LS400 and the entry-level LS250. As the figures for January to September 1990 showed, Lexus outsold Infiniti by 50,000 to 15,000. The reasons for Infiniti's slow start were threefold: First, the Infiniti Q45 came to the market after the Lexus LS400 had established a good market position. ■ Second, Lexus had two very good cars, whereas Infiniti's M30 coupe received poor evaluations from the automobile press and from customers. Finally, the eccentric Infiniti advertising campaign that showed scenes of nature, but not the car itself, shared some of the blame. ("Infiniti may not be doing so well, but, hey, at least sales of rocks and trees are skyrocketing," commented co- median Jay Leno.) RESEARCH DATA Exhibits 1-4 summarize some of the data that Infiniti had in early 1990. Data in Exhibits 1 and 2 are based on a survey of customers from its target segments, described as people between 25 and 35 with annual household incomes between $50,000 and $100,000 (when the survey was administered, the Lexus LS250 was not yet well known to the respondents to be included in the study). The three subsegments in Exhibit 1 (denoted S1, S2, and S3) are based on information provided by Infiniti managers. Exhibit 3 is derived from sales brochures describing the characteristics of each car. Exhibit 4 summarizes demographic and psychographic information about the three subsegments and was compiled from databases supplied by Claritas, Inc. 1. This case was developed by Katrin Starke and Arvind Rangaswamy and describes a real situa- tion using a mix of real and hypothetical data. Attractive Quiet Unreliable Poorly Built Interesting Sporty Uncomfortable Roomy Easy to Service High Prestige Common Economical Successful Avant-garde Poor Value Preferences Overall Segment 1 (51) Segment 11 (52) Segment III (53) Chapter 4: Positioning Ford Audi Toyota Lagle Honda Saab Pontiac BMW Mercury G20 T-bird 90 Supra Talon Prelude 900 Firebird 318i Capri 5.6 4.0 6.3 3.6 4.2 2.9 1.6 3.6 4.2 5.0 333 333 4.1 3.2 4.2 4.6 4.9 5.4 3.5 3.5 3.6 3.4 3.7 4.9 4.0 3.9 3.6 5.3 4.2 4.3 3.6 4.6 5.2 3.7 2.6 4.3 4.0 3.8 24 5.3 3.5 5.6 3.6 5.00 36 6.0 4.3 2.1 5.9 6.0 6.0 7.7 8.4 21 3.4 5.6 4.0 4.2 3.5 4.3 5.2 5.4 2.0 3.2 2.1 4.3 2.8 3.9 3.4 4.9 5.1 4.0 3.3 3.6 3.9 4.6 5.0 2.8 4.7 43 3.9 5.0 3.7 3.5 5.3 2.9 3.2 5.5 4.9 3.5 5.5 6.1 3.5 3.7 5.6 4.4 3.9 2.6 4.0 6.5 3.3 3.1 5.8 6.0 5.5 8.3 5.3 4.8 3.7 2.8 3.4 3.9 5.7 2.8 5.0 3.9 2.3 4.4 1.8 5.4 1.3 4.3 2.8 5.1 3.8 4.7 5.7 4.1 4.3 3.5 3.3 4.3 3.9 5.2 4.4 3.6 4.1 4.6 3.8 6.4 3.3 4.3 2.8 3,9 4.3 4.6 5.9 3.9 3.7 4.5 5.7 1.9 4.3 3.1 5.3 4.4 4.7 4.1 2.9 6.8 3.0 7.5 1.2 5.4 2.5 149 6.7 8.3 5.4 7.3 3.9 3.3 4.0 4.3 4.0 1.7 5.8 3.4 EXHIBIT 1 Survey results with average perception and average preference ratings on a scale from 1 to 9 (G20.DAT). 6 7 8 6 10 11 12 13 14 15 16 17 18 19 20 21 22 2.3 24 25 26 27 28 29 30 31 32 33 #66835SKERE 34 98 37 39 40 42 43 44 G20 4.0 4.0 8.0 7.0 O'N 5.0 3.0 4.0 N.O 4.0 5.0 6.0 6.0 8.0 5.0 6.0 6.0 7.0 6.0 50 7.0 4.0 8.0 8.0 9.0 Ford T-bird 9,0 8.0 8.0 5.0 9.0 8.0 7.0 8.0 5.0 1.0 8.0 6.0 0'6 6.0 4.0 8.0 8.0 7,0 0'9 0'9 3.0 O'S 5.0 2.0 5.0 5,0 9.0 9.0 0'6 8.0 9,0 7.0 7.0 9.0 9,0 8.0 7.0 9,0 4.0 9,0 2.0 6.0 4.0 8.0 0'9 3.0 1.0 1.0 2.0 9.0 1.0 8.0 1.0 Audi Toyota Eagle Honda Saab Pontiac BMW Mercury 90 Supra Talon Prelude 900 Firebird 318 Capri 2.0 8.0 2.0 9,0 2.0 8.0 3.0 9.0 3.0 8.0 6.0 5.0 1.0 2.0 2.0 4.0 3,0 4.0 2.0 20 66 9.0 8.0 3.0 2.0 8.0 9.0 9.0 2.0 8.0 5.0 7.0 9.0 6.0 6.0 8.0 6.0 9.0 4.0 8.0 5,0 8.0 7.0 1.0 3.0 4.0 5.0 8.0 4.0 1.0 3,0 5.0 4.0 3.0 4.0 3,0 4.0 6,0 #5 9,0 7.0 9,0 8,0 6.0 7.0 9,0 4.0 9.0 3.0 9,0 3.0 60 1.0 6.0 1.0 3.0 2.0 7.0 1.0 1.0 5,0 2.0 6.0 2.0 2.0 3.0 4.0 1.0 2.0 3.0 4.0 1.0 3.0 20 4.0 2.0 4.0 8.0 8.0 3.0 1.0 9,0 4.0 8.0 4,0 9.0 7,0 1.0 4.0 5.0 2.0 4.0 1.0 8,0 7.0 8.0 20 1.0 3.0 9,0 5.0 2.0 0'8 6.0 2.0 5.0 6.0 5.0 5.0 7.0 5,0 5.0 1.0 7,0 3.0 7.0 7.0 5.0 8.0 6.0 5.0 4.0 3.0 8.0 6.0 6.0 6.0 7.0 4.0 3.0 7.0 9.0 5,0 1.0 8.0 7,0 8.0 7,0 3,0 8.0 5.0 5.0 4,0 4.0 9,0 9,0 8,0 0'9 8.0 8,0 4.0 6.0 8.0 7.0 5.0 5.0 6.0 9.0 7.0 8,0 8.0 3.0 4.0 4.0 3.0 4.0 7,0 2.0 8.0 0'9 6.0 8.0 8.0 6.0 9.0 7,0 7.0 9.0 9,0 8.0 7,0 8.0 8.0 9,0 1.0 2.0 3.0 5.0 6.0 1.0 4.0 6.0 1.0 5.0 2.0 8,0 7.0 8.0 9.0 9.0 6.0 4.0 4.0 3.0 2.0 3.0 1.0 8.0 9.0 7.0 9.0 8.0 1.0 4.0 1.0 3.0 3,0 2.0 5.0 1.0 1.0 9.0 6.0 9.0 9.0 7.0 9.0 $.0 5.0 6.0 1.0 6.0 1.0 5.0 7,0 4.0 8.0 4.0 5.0 6.0 8.0 3.0 9.0 7.0 9.0 3.0 7.0 5.0 2.0 4.0 5.0 9.0 7.0 4.0 5.0 40 70 8.0 4.0 3,0 6.0 8.0 1,0 2.0 6.0 8.0 3,0 6.0 70 5.0 6.0 4.0 70. 40 6,0 8.0 9.0 5.0 8.0 5.0 8.0 5.0 5.0 70 8.0 9,0 9,0 4.0 7.0 9,0 9,0 9.0 6.0 9,0 70 9,0 50 5.0 2.0 4.0 3.0 6.0 7/0 6.0 60 7,0 8.0 7.0 0/9 5.0 70 3.0 3.0 4.0 10 5,0 5.0 3.0 3.0 5.0 5.0 7/0 4.0 1.0 30 6.0 1.0 5.0 6.0 09 20 50 10 4.0 6.0 6,0 1.0 1.0 6.0 20 5.0 4.0 EXHIBIT 2 Individual-level preference data, measured on a scale from 1 to 9, with higher numbers representing in- creased preference (G20PREFDAT). 45 46 47 48 49 50 51 52 53 54 55 56 57 58 59 09 61 62 63 64 65 66 67 68 70 RRRRRR 71 72 73 74 75 Ford Audi Toyota Eagle Honda Saab Pontiac BMW Mercury G20 T-bird 90 Supra Talon Prelude 900 Hrebird 318i Capri 8.0 9.0 9.0 9.0 9.0 8.0 9.0 5.0 7.0 4.0 7.0 2.0 2.0 3.0 1.0 2.0 3.0 1.0 5.0 2.0 4.0 5.0 7.0 10 5.0 3.0 4.0 4.0 8.0 4.0 8.0 7.0 3.0 3.0 O'N 4.0 5.0 8.0 2.0 5.0 6.0 7.0 4.0 7.0 7.0 7.0 8.0 2.0 3.0 6.0 20 6.0 5.0 5.0 8.0 9.0 4.0 5.0 4.0 7.0 7.0 2.0 4.0 4.0 2.0 9.0 3.0 5.0 8.0 6.0 1.0 3.0 20 6.0 7.0 3.0 7,0 9.0 9.0 8.0 9.0 9.0 7.0 7.0 1.0 3.0 5.0 3.0 5.0 4.0 4.0 4.0 6.0 3.0 5.0 5.0 8.0 7.0 7,0 2.0 20 5.0 3.0 8.0 8.0 7.0 5.0 1.0 5.0 5.0 4.0 5.0 6.0 3.0 6.0 6.0 5.0 6.0 2.0 8.0 8.0 6.0 20 7.0 5.0 4.0 5.0 7.0 4.0 6.0 1.0 7.0 5.0 3.0 6.0 S.D 5.0 6.0 2.0 5.0 3.0 4.0 4.0 2.0 09. 8.0 9.0 8.0 8.0 9.0 8.0 2.0 9.0 7.0 8.0 8.0 6.0 5.0 9.0 8.0 7.0 7.0 7.0 9.0 9.0 9.0 9.0 9.0 8.0 8.0 5.0 6.0 8.0 4.0 8.0 6.0 9.0 70 7.00 5.0 8.0 8.0 5.0 7.0 8.0 3.0 8.0 9.0 7.0 6.0 7.0 4.0 6.0 2.0 3,0 5,0 1.0 1.0 1.0 4.0 20 2.0 8.0 3,0 9.0 7.0 4.0 8.0 9.0 1.0 60 9.0 4.0 8.0 5.0 7.0 4.0 7.0 5.0 4.0 4.0 8.0 6.0 1.0 2.0 4.0 1.0 4.0 2.0 20 6.0 5.0 9.0 8.0 8.0 7.0 7.0 8.0 9.0 5.0 8.0 9.0 0'9 6.0 9.0 6.0 7.0 7.0 9.0 8.0 6.0 9.0 6.0 3.0 4.0 8.0 9.0 8.0 5.0 4.0 1.0 4.0 1.0 5.0 1.0 3.0 4.0 6.0 1.0 4.0 5.0 1.0 4.0 4.0 3.0 2.0 1.0 4.0 2.0 6.0 5.0 1.0 5.0 1.0 5.0 4.0 EXHIBIT 2 cont'd Individual-level preference dato, measured on a scale from 1 to 9, with higher numbers representing in creased preference (G20PREFDAT) Base Price (5) Length (Inches) Width (Inches) Height (Inches) Curb Weight (lbs.) Fuel Economy (Mpg) City Highway Ford Audi Toyota Eagle Honda Saab Pontiac BMW Mercury G20 T-bird 90 Supra Talon Prelude 900 Firebird 318i Capri 17,500 15,783 20,200 23,280 16,437 14,945 18,295 175 198.7 176 181.9 170.5 1756 184.5 66.7 72.7 67.6 68.7 54.9 52.7 54.3 2,535 3,600 3.170 24 32 17 24 18 24 Horspower, 1400 2100 1640 SAE.net 6,400 4,000 6,000 (hp) rpm rpm EXHIBIT 3 Some physical characteristics of the cars 66.7 67.3 66.5 51.2 51.4 29.2 3,535 17 22 56.1 3,100 2.740 2,825 20 25 23 27 2320 1950 1350 5,600 6,000 6.200 rpm rpm rpm 20 26 1400 6,000 rpm 12.690 19,900 13.500 1920 170.3 166.1 72.4 64.8 64.6 49.8 53.5 50.2 3,485 2,600 2,487 16 24 27 23 2400 1340 1320 4,400 6,000 6,000 rpm rpm rpm 1/ 3/ 1/ 3/ M 1/ Warranty, Years/Miles, 60,000 12,000 50,000 36,000 12,000 36000 36,000 50,000 36,000 12,000 Segment Characteristics Segment Size Education Predominant Employment Age Group Predominant Ethnic Background Average Household Income Persons Percent Married per Household Watch Late Night TV Watch Daytime TV Read Computer Magazines Read Business Magazines Read Entertainment Magazines Read Infant and Parenting Magazines Rent Movies Possess an American Go Fishing Sail, Scuba Dive, or ski Segment I (Western Yuppie, Single) EXHIBIT 4 Dato about the segments (25%) College Grads Professionals 25-35 White $81,000 1.42 329 27% 396 Express Cand 48% Own Investment Funds 24% 39% Segment II (Upwardly Mobile Families) (45%) College Grads or Some College White Collar 25-35 White $68,000 3.8 75% 9% 45% 6% 23% 17% 85% 45% 18% 30% Segment Ill (American Dreamers) (30%) College Grads or Some College White Collar 25-35 Mix (Asian, White) $59,000 24 55% 17% 5% 10% 27% 30% 2% 75% 47% 20% EXERCISES 1. Describe the two (or, if applicable, three) dimensions underlying the percep tual maps that you generated. Based on these maps, how do people in this market perceive the Infiniti G20 compared with its competitors? 2. Infiniti promoted the G20 as a Japanese car (basic version $17,500) with a German feel, basically a car that was like the BMW 318 ($20,000), but lower priced. Is this a credible claim, given the perceptions and preferences of the respondents? 3. Which attributes are most important in influencing preference for these cars in the three segments (S1, S2, and $3) shown on these maps? To which segment(s) would you market the Infiniti G207 How would you reposition the Infiniti G20 to best suit the chosen segmentis)? Briefly describe the marketing program you would use to target the chosen segment(s). 4. What ongoing research program would you recommend to Infiniti to improve its evaluation of its segmentation of the market and positioning of its G20? 5. Summarize the advantages and limitations of the software provided for this application. In April 1990, Nissan's Infiniti division planned to introduce the G20 in the United States, adding a third model to the existing Infiniti line. The G20 was already avail- able in Europe and Japan under the name Primera. The car, equipped with a four- cylinder engine developing 140 horsepower, would be Infiniti's entry-level luxury car. Initial market response to the G20 in the United States was disappointing, and management wondered how it might retarget or reposition the car to improve its market performance. BACKGROUND In 1989, three years after Honda first introduced its Acura line, Toyota and Nissan at- tacked the U.S. luxury car market, a segment previously dominated by American and German manufacturers. In November 1989, Nissan launched its new luxury Infiniti division with the $40,000 Q45 as its lead car and the $20,000 M30. However, Nissan was somewhat late: in August 1989, three months before Nissan shipped its first Infiniti, Toyota had intro- duced Lexus, its luxury brand, with a two-car line comprising the $40,000 LS400 and the entry-level LS250. As the figures for January to September 1990 showed, Lexus outsold Infiniti by 50,000 to 15,000. The reasons for Infiniti's slow start were threefold: First, the Infiniti Q45 came to the market after the Lexus LS400 had established a good market position. ■ Second, Lexus had two very good cars, whereas Infiniti's M30 coupe received poor evaluations from the automobile press and from customers. Finally, the eccentric Infiniti advertising campaign that showed scenes of nature, but not the car itself, shared some of the blame. ("Infiniti may not be doing so well, but, hey, at least sales of rocks and trees are skyrocketing," commented co- median Jay Leno.) RESEARCH DATA Exhibits 1-4 summarize some of the data that Infiniti had in early 1990. Data in Exhibits 1 and 2 are based on a survey of customers from its target segments, described as people between 25 and 35 with annual household incomes between $50,000 and $100,000 (when the survey was administered, the Lexus LS250 was not yet well known to the respondents to be included in the study). The three subsegments in Exhibit 1 (denoted S1, S2, and S3) are based on information provided by Infiniti managers. Exhibit 3 is derived from sales brochures describing the characteristics of each car. Exhibit 4 summarizes demographic and psychographic information about the three subsegments and was compiled from databases supplied by Claritas, Inc. 1. This case was developed by Katrin Starke and Arvind Rangaswamy and describes a real situa- tion using a mix of real and hypothetical data. Attractive Quiet Unreliable Poorly Built Interesting Sporty Uncomfortable Roomy Easy to Service High Prestige Common Economical Successful Avant-garde Poor Value Preferences Overall Segment 1 (51) Segment 11 (52) Segment III (53) Chapter 4: Positioning Ford Audi Toyota Lagle Honda Saab Pontiac BMW Mercury G20 T-bird 90 Supra Talon Prelude 900 Firebird 318i Capri 5.6 4.0 6.3 3.6 4.2 2.9 1.6 3.6 4.2 5.0 333 333 4.1 3.2 4.2 4.6 4.9 5.4 3.5 3.5 3.6 3.4 3.7 4.9 4.0 3.9 3.6 5.3 4.2 4.3 3.6 4.6 5.2 3.7 2.6 4.3 4.0 3.8 24 5.3 3.5 5.6 3.6 5.00 36 6.0 4.3 2.1 5.9 6.0 6.0 7.7 8.4 21 3.4 5.6 4.0 4.2 3.5 4.3 5.2 5.4 2.0 3.2 2.1 4.3 2.8 3.9 3.4 4.9 5.1 4.0 3.3 3.6 3.9 4.6 5.0 2.8 4.7 43 3.9 5.0 3.7 3.5 5.3 2.9 3.2 5.5 4.9 3.5 5.5 6.1 3.5 3.7 5.6 4.4 3.9 2.6 4.0 6.5 3.3 3.1 5.8 6.0 5.5 8.3 5.3 4.8 3.7 2.8 3.4 3.9 5.7 2.8 5.0 3.9 2.3 4.4 1.8 5.4 1.3 4.3 2.8 5.1 3.8 4.7 5.7 4.1 4.3 3.5 3.3 4.3 3.9 5.2 4.4 3.6 4.1 4.6 3.8 6.4 3.3 4.3 2.8 3,9 4.3 4.6 5.9 3.9 3.7 4.5 5.7 1.9 4.3 3.1 5.3 4.4 4.7 4.1 2.9 6.8 3.0 7.5 1.2 5.4 2.5 149 6.7 8.3 5.4 7.3 3.9 3.3 4.0 4.3 4.0 1.7 5.8 3.4 EXHIBIT 1 Survey results with average perception and average preference ratings on a scale from 1 to 9 (G20.DAT). 6 7 8 6 10 11 12 13 14 15 16 17 18 19 20 21 22 2.3 24 25 26 27 28 29 30 31 32 33 #66835SKERE 34 98 37 39 40 42 43 44 G20 4.0 4.0 8.0 7.0 O'N 5.0 3.0 4.0 N.O 4.0 5.0 6.0 6.0 8.0 5.0 6.0 6.0 7.0 6.0 50 7.0 4.0 8.0 8.0 9.0 Ford T-bird 9,0 8.0 8.0 5.0 9.0 8.0 7.0 8.0 5.0 1.0 8.0 6.0 0'6 6.0 4.0 8.0 8.0 7,0 0'9 0'9 3.0 O'S 5.0 2.0 5.0 5,0 9.0 9.0 0'6 8.0 9,0 7.0 7.0 9.0 9,0 8.0 7.0 9,0 4.0 9,0 2.0 6.0 4.0 8.0 0'9 3.0 1.0 1.0 2.0 9.0 1.0 8.0 1.0 Audi Toyota Eagle Honda Saab Pontiac BMW Mercury 90 Supra Talon Prelude 900 Firebird 318 Capri 2.0 8.0 2.0 9,0 2.0 8.0 3.0 9.0 3.0 8.0 6.0 5.0 1.0 2.0 2.0 4.0 3,0 4.0 2.0 20 66 9.0 8.0 3.0 2.0 8.0 9.0 9.0 2.0 8.0 5.0 7.0 9.0 6.0 6.0 8.0 6.0 9.0 4.0 8.0 5,0 8.0 7.0 1.0 3.0 4.0 5.0 8.0 4.0 1.0 3,0 5.0 4.0 3.0 4.0 3,0 4.0 6,0 #5 9,0 7.0 9,0 8,0 6.0 7.0 9,0 4.0 9.0 3.0 9,0 3.0 60 1.0 6.0 1.0 3.0 2.0 7.0 1.0 1.0 5,0 2.0 6.0 2.0 2.0 3.0 4.0 1.0 2.0 3.0 4.0 1.0 3.0 20 4.0 2.0 4.0 8.0 8.0 3.0 1.0 9,0 4.0 8.0 4,0 9.0 7,0 1.0 4.0 5.0 2.0 4.0 1.0 8,0 7.0 8.0 20 1.0 3.0 9,0 5.0 2.0 0'8 6.0 2.0 5.0 6.0 5.0 5.0 7.0 5,0 5.0 1.0 7,0 3.0 7.0 7.0 5.0 8.0 6.0 5.0 4.0 3.0 8.0 6.0 6.0 6.0 7.0 4.0 3.0 7.0 9.0 5,0 1.0 8.0 7,0 8.0 7,0 3,0 8.0 5.0 5.0 4,0 4.0 9,0 9,0 8,0 0'9 8.0 8,0 4.0 6.0 8.0 7.0 5.0 5.0 6.0 9.0 7.0 8,0 8.0 3.0 4.0 4.0 3.0 4.0 7,0 2.0 8.0 0'9 6.0 8.0 8.0 6.0 9.0 7,0 7.0 9.0 9,0 8.0 7,0 8.0 8.0 9,0 1.0 2.0 3.0 5.0 6.0 1.0 4.0 6.0 1.0 5.0 2.0 8,0 7.0 8.0 9.0 9.0 6.0 4.0 4.0 3.0 2.0 3.0 1.0 8.0 9.0 7.0 9.0 8.0 1.0 4.0 1.0 3.0 3,0 2.0 5.0 1.0 1.0 9.0 6.0 9.0 9.0 7.0 9.0 $.0 5.0 6.0 1.0 6.0 1.0 5.0 7,0 4.0 8.0 4.0 5.0 6.0 8.0 3.0 9.0 7.0 9.0 3.0 7.0 5.0 2.0 4.0 5.0 9.0 7.0 4.0 5.0 40 70 8.0 4.0 3,0 6.0 8.0 1,0 2.0 6.0 8.0 3,0 6.0 70 5.0 6.0 4.0 70. 40 6,0 8.0 9.0 5.0 8.0 5.0 8.0 5.0 5.0 70 8.0 9,0 9,0 4.0 7.0 9,0 9,0 9.0 6.0 9,0 70 9,0 50 5.0 2.0 4.0 3.0 6.0 7/0 6.0 60 7,0 8.0 7.0 0/9 5.0 70 3.0 3.0 4.0 10 5,0 5.0 3.0 3.0 5.0 5.0 7/0 4.0 1.0 30 6.0 1.0 5.0 6.0 09 20 50 10 4.0 6.0 6,0 1.0 1.0 6.0 20 5.0 4.0 EXHIBIT 2 Individual-level preference data, measured on a scale from 1 to 9, with higher numbers representing in- creased preference (G20PREFDAT). 45 46 47 48 49 50 51 52 53 54 55 56 57 58 59 09 61 62 63 64 65 66 67 68 70 RRRRRR 71 72 73 74 75 Ford Audi Toyota Eagle Honda Saab Pontiac BMW Mercury G20 T-bird 90 Supra Talon Prelude 900 Hrebird 318i Capri 8.0 9.0 9.0 9.0 9.0 8.0 9.0 5.0 7.0 4.0 7.0 2.0 2.0 3.0 1.0 2.0 3.0 1.0 5.0 2.0 4.0 5.0 7.0 10 5.0 3.0 4.0 4.0 8.0 4.0 8.0 7.0 3.0 3.0 O'N 4.0 5.0 8.0 2.0 5.0 6.0 7.0 4.0 7.0 7.0 7.0 8.0 2.0 3.0 6.0 20 6.0 5.0 5.0 8.0 9.0 4.0 5.0 4.0 7.0 7.0 2.0 4.0 4.0 2.0 9.0 3.0 5.0 8.0 6.0 1.0 3.0 20 6.0 7.0 3.0 7,0 9.0 9.0 8.0 9.0 9.0 7.0 7.0 1.0 3.0 5.0 3.0 5.0 4.0 4.0 4.0 6.0 3.0 5.0 5.0 8.0 7.0 7,0 2.0 20 5.0 3.0 8.0 8.0 7.0 5.0 1.0 5.0 5.0 4.0 5.0 6.0 3.0 6.0 6.0 5.0 6.0 2.0 8.0 8.0 6.0 20 7.0 5.0 4.0 5.0 7.0 4.0 6.0 1.0 7.0 5.0 3.0 6.0 S.D 5.0 6.0 2.0 5.0 3.0 4.0 4.0 2.0 09. 8.0 9.0 8.0 8.0 9.0 8.0 2.0 9.0 7.0 8.0 8.0 6.0 5.0 9.0 8.0 7.0 7.0 7.0 9.0 9.0 9.0 9.0 9.0 8.0 8.0 5.0 6.0 8.0 4.0 8.0 6.0 9.0 70 7.00 5.0 8.0 8.0 5.0 7.0 8.0 3.0 8.0 9.0 7.0 6.0 7.0 4.0 6.0 2.0 3,0 5,0 1.0 1.0 1.0 4.0 20 2.0 8.0 3,0 9.0 7.0 4.0 8.0 9.0 1.0 60 9.0 4.0 8.0 5.0 7.0 4.0 7.0 5.0 4.0 4.0 8.0 6.0 1.0 2.0 4.0 1.0 4.0 2.0 20 6.0 5.0 9.0 8.0 8.0 7.0 7.0 8.0 9.0 5.0 8.0 9.0 0'9 6.0 9.0 6.0 7.0 7.0 9.0 8.0 6.0 9.0 6.0 3.0 4.0 8.0 9.0 8.0 5.0 4.0 1.0 4.0 1.0 5.0 1.0 3.0 4.0 6.0 1.0 4.0 5.0 1.0 4.0 4.0 3.0 2.0 1.0 4.0 2.0 6.0 5.0 1.0 5.0 1.0 5.0 4.0 EXHIBIT 2 cont'd Individual-level preference dato, measured on a scale from 1 to 9, with higher numbers representing in creased preference (G20PREFDAT) Base Price (5) Length (Inches) Width (Inches) Height (Inches) Curb Weight (lbs.) Fuel Economy (Mpg) City Highway Ford Audi Toyota Eagle Honda Saab Pontiac BMW Mercury G20 T-bird 90 Supra Talon Prelude 900 Firebird 318i Capri 17,500 15,783 20,200 23,280 16,437 14,945 18,295 175 198.7 176 181.9 170.5 1756 184.5 66.7 72.7 67.6 68.7 54.9 52.7 54.3 2,535 3,600 3.170 24 32 17 24 18 24 Horspower, 1400 2100 1640 SAE.net 6,400 4,000 6,000 (hp) rpm rpm EXHIBIT 3 Some physical characteristics of the cars 66.7 67.3 66.5 51.2 51.4 29.2 3,535 17 22 56.1 3,100 2.740 2,825 20 25 23 27 2320 1950 1350 5,600 6,000 6.200 rpm rpm rpm 20 26 1400 6,000 rpm 12.690 19,900 13.500 1920 170.3 166.1 72.4 64.8 64.6 49.8 53.5 50.2 3,485 2,600 2,487 16 24 27 23 2400 1340 1320 4,400 6,000 6,000 rpm rpm rpm 1/ 3/ 1/ 3/ M 1/ Warranty, Years/Miles, 60,000 12,000 50,000 36,000 12,000 36000 36,000 50,000 36,000 12,000 Segment Characteristics Segment Size Education Predominant Employment Age Group Predominant Ethnic Background Average Household Income Persons Percent Married per Household Watch Late Night TV Watch Daytime TV Read Computer Magazines Read Business Magazines Read Entertainment Magazines Read Infant and Parenting Magazines Rent Movies Possess an American Go Fishing Sail, Scuba Dive, or ski Segment I (Western Yuppie, Single) EXHIBIT 4 Dato about the segments (25%) College Grads Professionals 25-35 White $81,000 1.42 329 27% 396 Express Cand 48% Own Investment Funds 24% 39% Segment II (Upwardly Mobile Families) (45%) College Grads or Some College White Collar 25-35 White $68,000 3.8 75% 9% 45% 6% 23% 17% 85% 45% 18% 30% Segment Ill (American Dreamers) (30%) College Grads or Some College White Collar 25-35 Mix (Asian, White) $59,000 24 55% 17% 5% 10% 27% 30% 2% 75% 47% 20% EXERCISES 1. Describe the two (or, if applicable, three) dimensions underlying the percep tual maps that you generated. Based on these maps, how do people in this market perceive the Infiniti G20 compared with its competitors? 2. Infiniti promoted the G20 as a Japanese car (basic version $17,500) with a German feel, basically a car that was like the BMW 318 ($20,000), but lower priced. Is this a credible claim, given the perceptions and preferences of the respondents? 3. Which attributes are most important in influencing preference for these cars in the three segments (S1, S2, and $3) shown on these maps? To which segment(s) would you market the Infiniti G207 How would you reposition the Infiniti G20 to best suit the chosen segmentis)? Briefly describe the marketing program you would use to target the chosen segment(s). 4. What ongoing research program would you recommend to Infiniti to improve its evaluation of its segmentation of the market and positioning of its G20? 5. Summarize the advantages and limitations of the software provided for this application.
Expert Answer:
Answer rating: 100% (QA)
1 The positioning map displays the xaxis from left to right as high quality to ... View the full answer

Related Book For 

Posted Date:
Students also viewed these accounting questions
-
Performance Auto Company operates a New Car Division (that sells high performance sports cars) and a Performance Parts Division (that sells performance improve ment parts for family cars). Some...
-
A certain make of car comes equipped with an engine in one of four sizes (in liters): 2.8, 3.0, 3.3, or 3.8. Ten percent of customers order the 2.8 liter engine, 40% order the 3.0, 30% order the 3.3,...
-
The compact car market in the United States is extremely competitive. Sales for six of the top models for six months in 2011 follow (Motor Trend, November 2, 2011)? At the .05 level of significance,...
-
Describes 7shifts' pioneering role in revolutionizing restaurant management through cloud-based solutions.
-
Suppose that you, after studying economics in college, quickly became rich so rich that you have nothing better to do than worry about your 16-year old niece who cant seemto focus on her future. Your...
-
Vulcan Companys contribution format income statement for June is given below: Management is disappointed with the companys performance and is wondering what can be done to improve profits. By...
-
An oil engine work on diesel cycle with temperature of \(27^{\circ} \mathrm{C}\) at the beginning of compression. If the ratio of adiabatic expansion is 8 , find the thermal efficiency of cycle....
-
The Engine Shop uses a job order cost system to determine the cost of performing engine repair work. Estimated costs and expenses for the coming period are as follows: Engine parts ............ $...
-
You have a credit card balance of $4,300 and are able to make payments of $125 per month. Assume the credit card company charges an annual interest rate of 22%. How many months will it take to pay...
-
What percent of undergraduate enrollment in coed colleges and universities in the United States is male? A random sample of 50 such institutions give the following data (Source USA Today allege...
-
Suppose we have a stock with a standard deviation of 23.55%. The market standard deviation is 13.12% The correlation coefficient for the stock and the market is 91. What is the Beta of the stock? A....
-
What is the Federal Open Market Committee and what are its main functions?
-
A firm agreed to pay its workers $20 an hour in 2019 and $22 an hour in 2020. The price level for these years was 256 in 2019 and 260 in 2020. Calculate the real wage rate in each year. What is the...
-
Most of us are tempted from time to time to take shortcuts to solve our problems. Fortunately, most of us also resist that temptation. Instead, we work for what we have; we pay our bills, and we wait...
-
The Fed Will Not Extend a Pandemic-Crisis Rule The Federal Reserve has decided against extending a pandemic era rule that relaxed the amount of capital banks had to hold. What is the capital in the...
-
What was the exchange rate policy adopted by China after July 2005? Explain how it works. Chinas designation as a currency manipulator has been officially removed by the Trump administration. As part...
-
Victoria lived in her house as a primary residence from 2013 until November 2021. At that time, she converted the house to a rental property. In November 2022, she sold the property. Victoria files...
-
Identify Thank You mission, strategy and core competencies. Identify strategy changes that have taken place at Thank You since its founding in 2008. Your answer must in text references and must be...
-
A chemist is calibrating a spectrophotometer that will be used to measure the concentration of carbon monoxide (CO) in atmospheric samples. To check the calibration, samples of known concentration...
-
In a study of the effect of cooling rate on the hardness of welded joints, 50 welds cooled at a rate of 10C/s had an average Rockwell (B) hardness of 91.1 and a standard deviation of 6.23, and 40...
-
Do bathroom scales tend to underestimate a person's true weight? A 150 lb test weight was placed on each of 50 bathroom scales. The readings on 29 of the scales were too light, and the readings on...
-
Climates farther from the equator usually have (a) lower average temperatures. (b) higher solar intensity. (c) more precipitation. (d) more water.
-
Climate change (a) is a subject most scientists disagree about. (b) refers to the effect of greenhouse gases on atmospheric temperature. (c) refers to temperature increases in all of Earths climate...
-
How is a tsunami similar to a ripple in a pond? How do they differ?

Study smarter with the SolutionInn App