

Question: No clue how to do this using Matlab, please show how to do this using Matlab. Fiber Strength 19.6 Concentration of Polymer 2 Concentration of
No clue how to do this using Matlab, please show how to do this using Matlab.
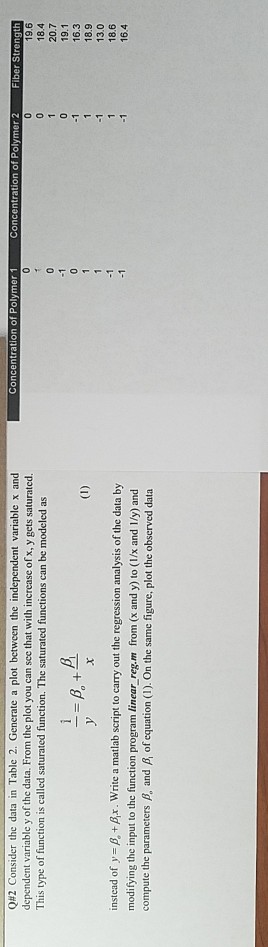
Fiber Strength 19.6 Concentration of Polymer 2 Concentration of Polymer 1 Q#2 Consider the data in Table 2, Generate a plot between the independent variable x and dependent variable y of the data. From the plot you can see that with increase of x, y gets saturated. This type of function is called saturated function. The saturated functions can be modeled as 20.7 19.1 16.3 18.9 13.0 18.6 16.4 rx instead of y B,+Bx. Write a matlab script to carry out the regression analysis of the data by modifying the input to the function program linear_reg.m from (x and y) to (I/x and I/y) and compute the parameters B, and B of equation (I). On the same figure, plot the observed data
Step by Step Solution
There are 3 Steps involved in it

Get step-by-step solutions from verified subject matter experts