

Question: no idea with this Question 1 {1 point) Measurements on two variablesI X and Y, were taken from 180 individuals with the following summary statistics:
no idea with this
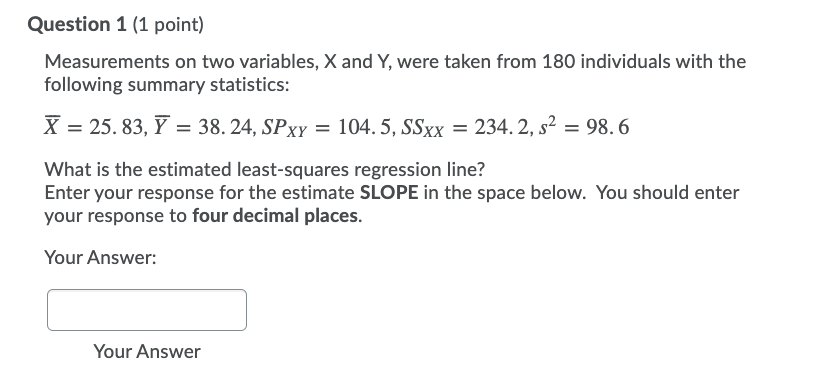
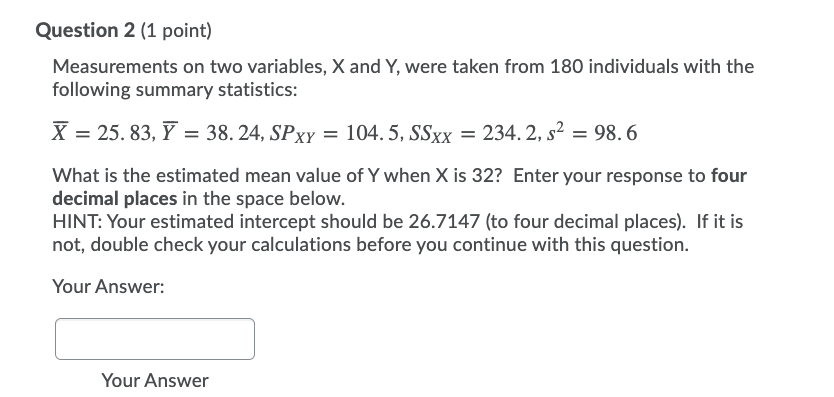
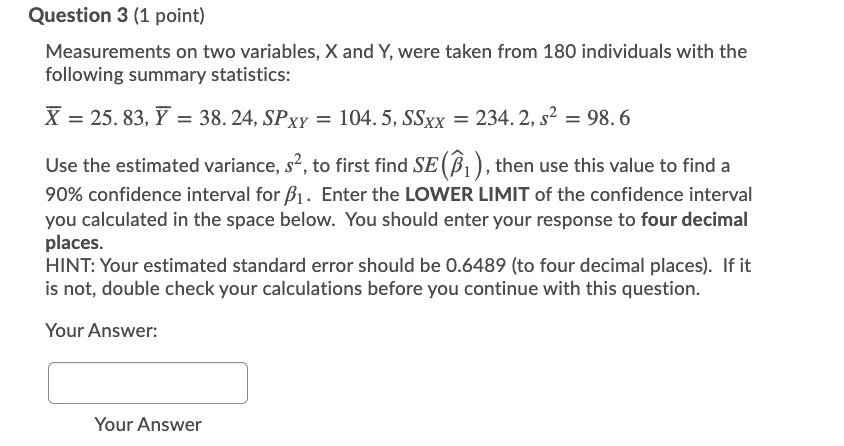
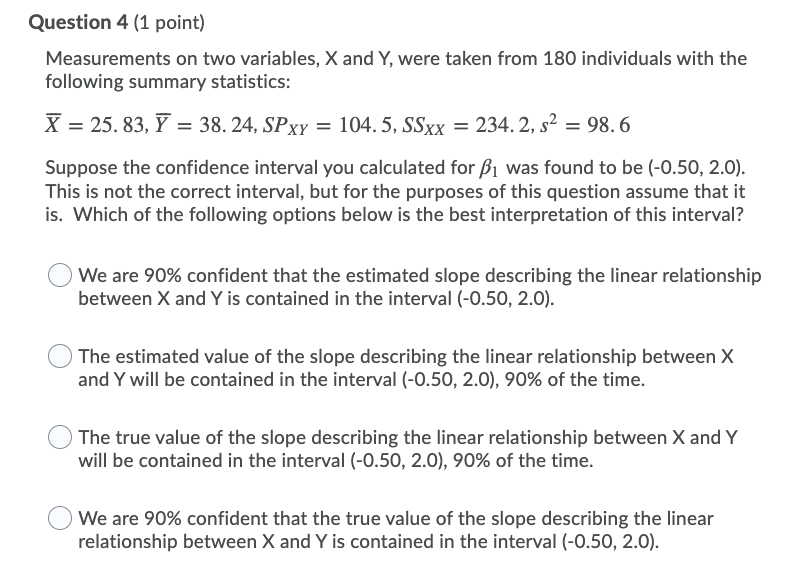
Question 1 {1 point) Measurements on two variablesI X and Y, were taken from 180 individuals with the following summary statistics: )7 = 25. 33, 17 = 33. 24, 5'ny = 104. 5. SSH = 234. 2, 52 = 98. 6 What is the estimated least-squares regression line? Enter your response for the estimate SLOPE in the space below. You should enter your response to four decimal places. Your Answer: Your Answer Question 2 {1 point) Measurements on two variablesI X and Y, were taken from 180 individuals with the following summary statistics: 2? = 25. 33. I7 = 33. 24, .3ny = 104. 5. SSH = 234. 2. 52 = 98.6 What is the estimated mean value onwhen X is 32? Enter your response to four decimal places in the space below. HINT: Your estimated intercept should he 26.114? (to four decimal places). If it is not. double check your calculations before you continue with this question. Your Answer: Your Answer Question 3 (1 point) Measurements on two variables, X and Y, were taken from 180 individuals with the following summary statistics: X = 25. 83, Y = 38. 24, SPxy = 104. 5, SSxx = 234.2, $2 = 98. 6 Use the estimated variance, s, to first find SE (B1 ), then use this value to find a 90% confidence interval for 1. Enter the LOWER LIMIT of the confidence interval you calculated in the space below. You should enter your response to four decimal places. HINT: Your estimated standard error should be 0.6489 (to four decimal places). If it is not, double check your calculations before you continue with this question. Your Answer: Your AnswerQuestion 4 {1 point} Measurements on two variablesI X and Y, were taken from 180 individuals with the following summarv statistics: 2? = 25. 33. 1" = 33. 24. .57ny = 104. 5. 33;; = 234. 2. 52 = 93. 6 Suppose the confidence interval you calculated for )31 was found to be (-0.50, 2.0). This is not the correct interval, but for the purposes of this question assume that it is. Which of the following options below is the best interpretation of this interval? 0 We are 90% confident that the estimated slope describing the linear relationship between X and Y is contained in the interval (-0.50, 2.0]. O The estimated value of the slope describing the linear relationship between X and Y will be contained in the interval (-0.50, 2.0}, 90% of the time. 0 The true value of the slope describing the linear relationship between X and Y will be contained in the interval (-0.50, 2.0}, 90% of the time. 0 We are 90% confident that the true value of the slope describing the linear relationship between X and Y is contained in the interval (-0.50, 2.0)
Step by Step Solution
There are 3 Steps involved in it

Get step-by-step solutions from verified subject matter experts