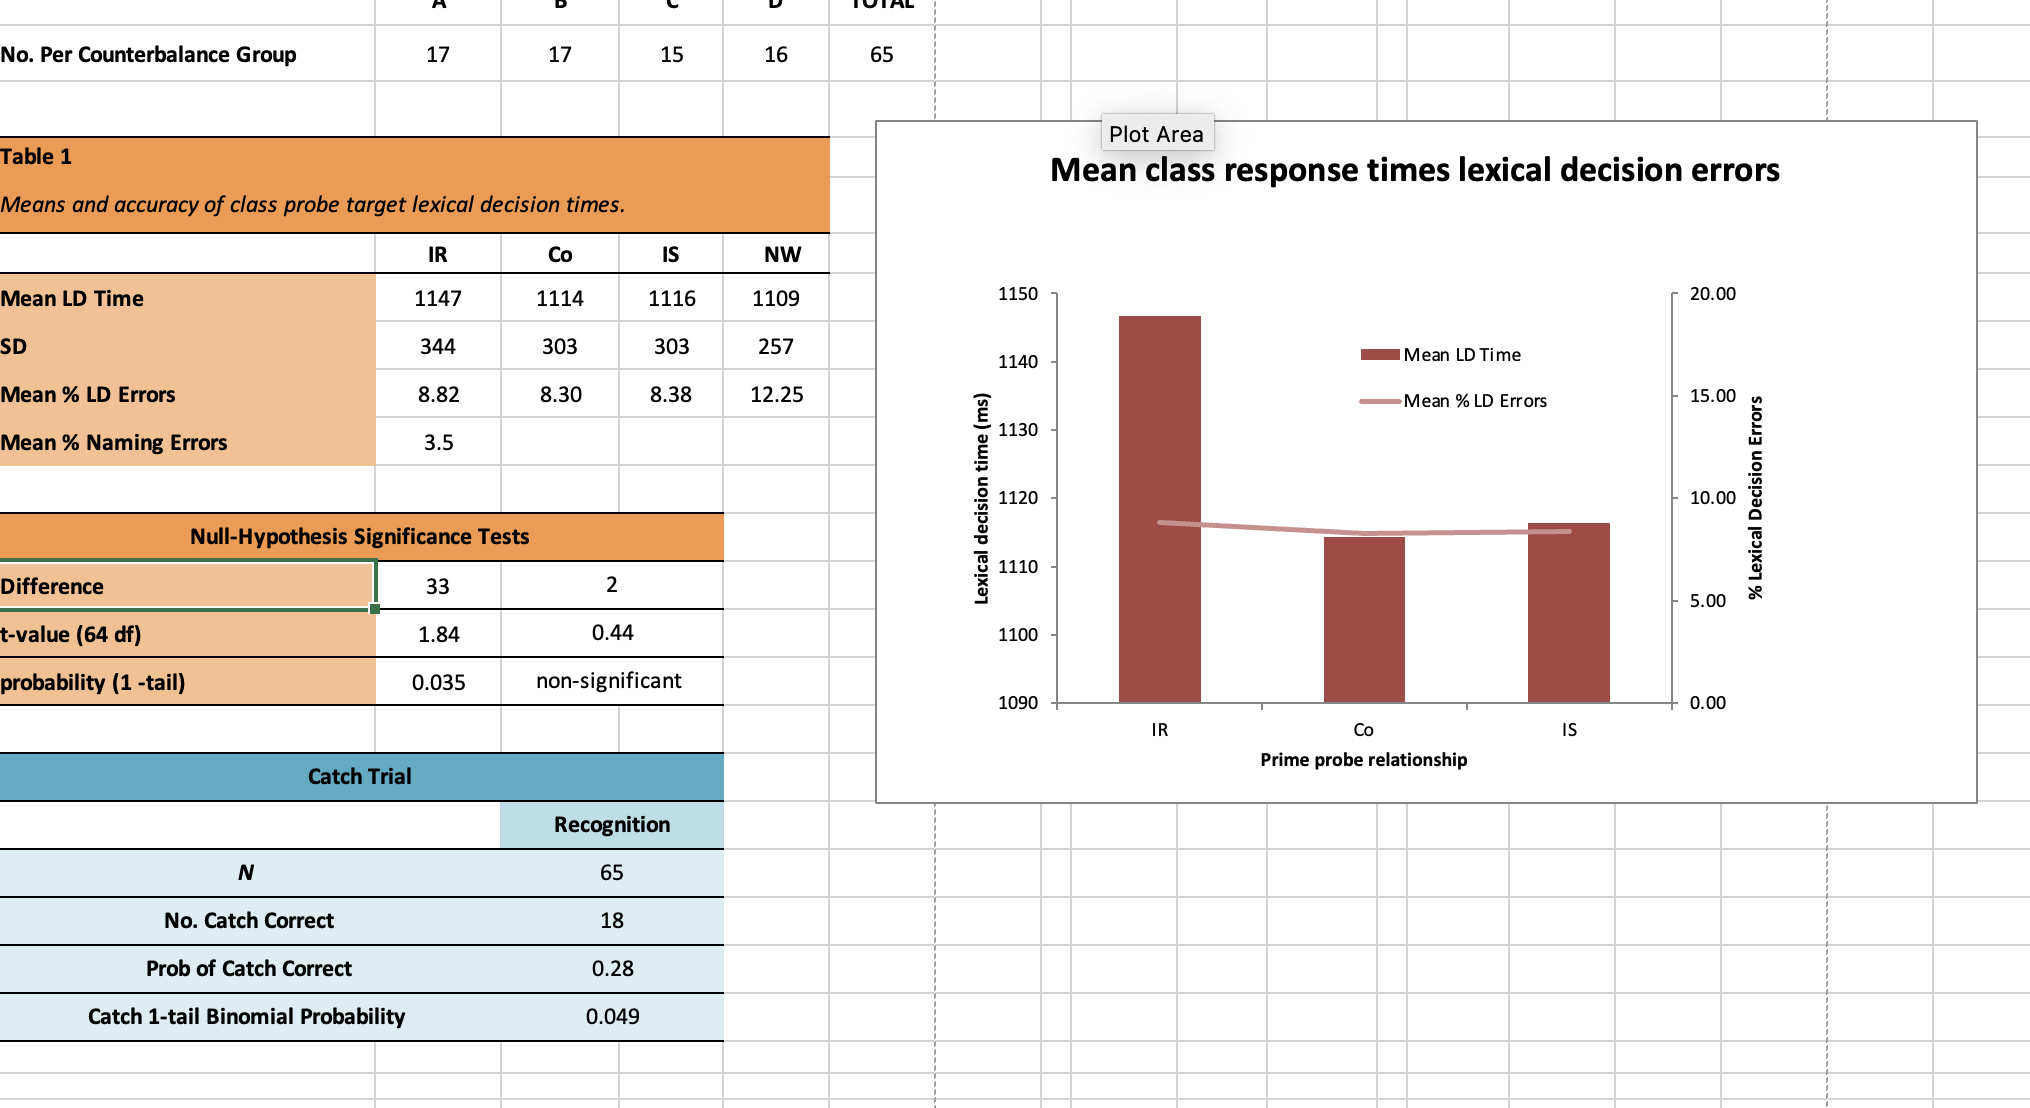
Question: No. Per Counterbalance Group 17 17 15 16 65 Plot Area Table 1 Mean class response times lexical decision errors Means and accuracy of class

No. Per Counterbalance Group 17 17 15 16 65 Plot
No. Per Counterbalance Group 17 17 15 16 65 Plot Area Table 1 Mean class response times lexical decision errors Means and accuracy of class probe target lexical decision times. IR Co IS NW Mean LD Time 1147 1114 1116 1109 1150 20.00 SD 344 303 303 257 1140 Mean LD Time Mean % LD Errors 8.82 8.30 8.38 12.25 Mean % LD Errors 15.00 Mean % Naming Errors 3.5 1130 Lexical decision time (ms) 1120 10.00 % Lexical Decision Errors Null-Hypothesis Significance Tests 1110 Difference 33 2 5.00 t-value (64 df) 1.84 0.44 1100 probability (1 -tail) 0.035 non-significant 1090 0.00 IR Co IS Prime probe relationship Catch Trial Recognition N 65 No. Catch Correct 18 Prob of Catch Correct 0.28 Catch 1-tail Binomial Probability 0.049

Step by Step Solution

There are 3 Steps involved in it

1 Expert Approved Answer
Step: 1 Unlock blur-text-image
Question Has Been Solved by an Expert!

Get step-by-step solutions from verified subject matter experts

Step: 2 Unlock
Step: 3 Unlock

Students Have Also Explored These Related Mathematics Questions!