Question: NO3D(1~1. THE File Edit Notebook Insert Compute Graph Examples Help heavy | line, colored |Blue Here they are together. O D g (x ) =
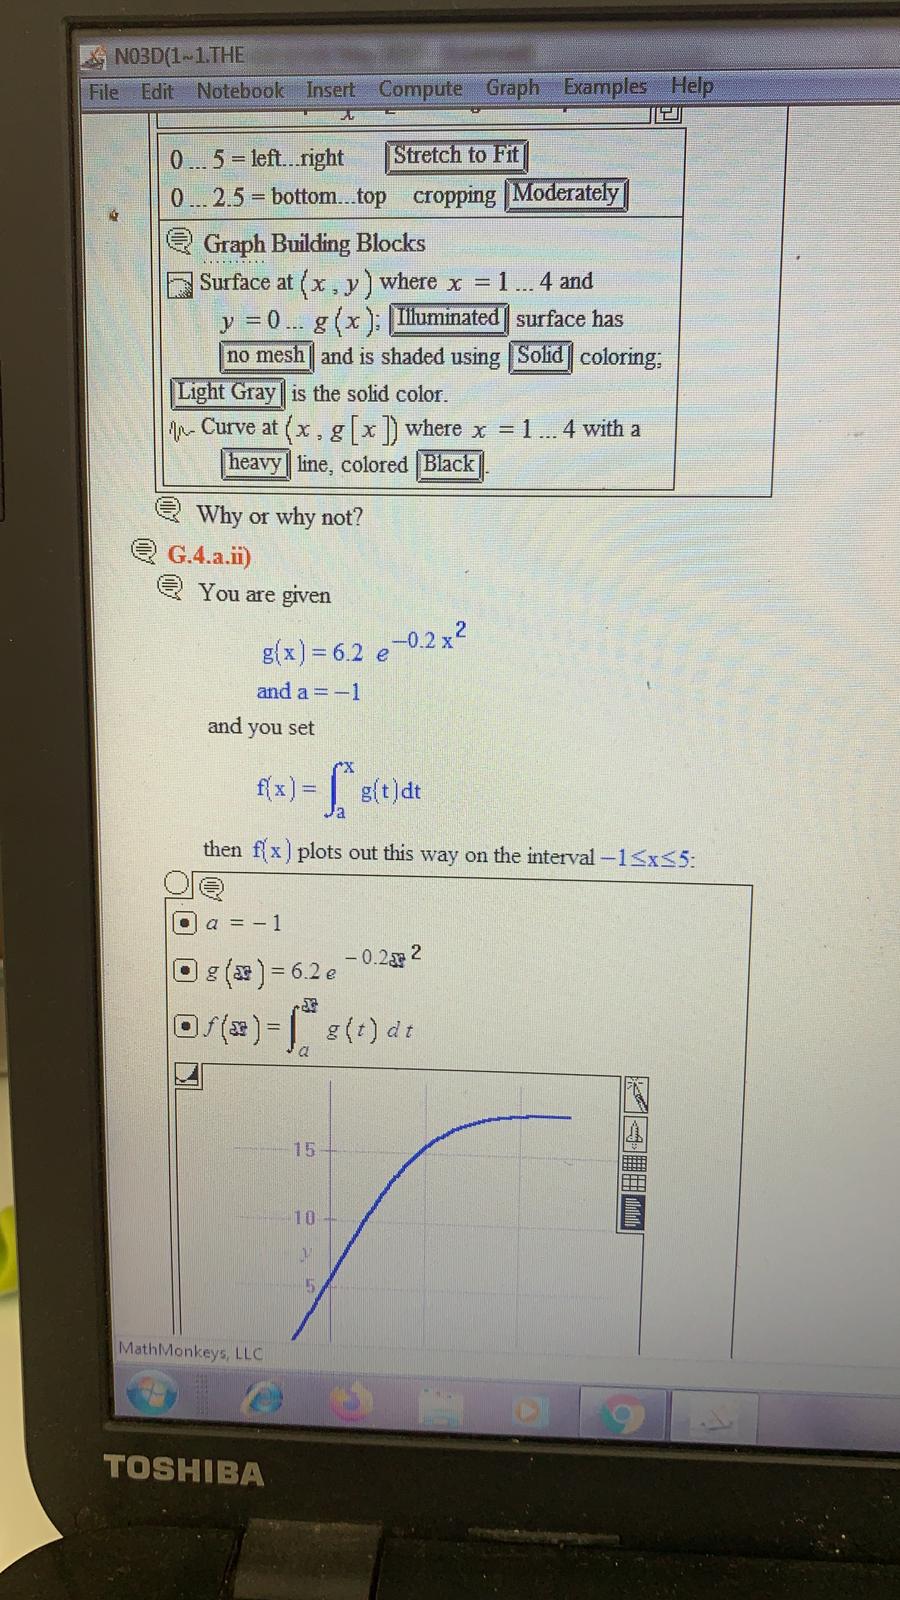
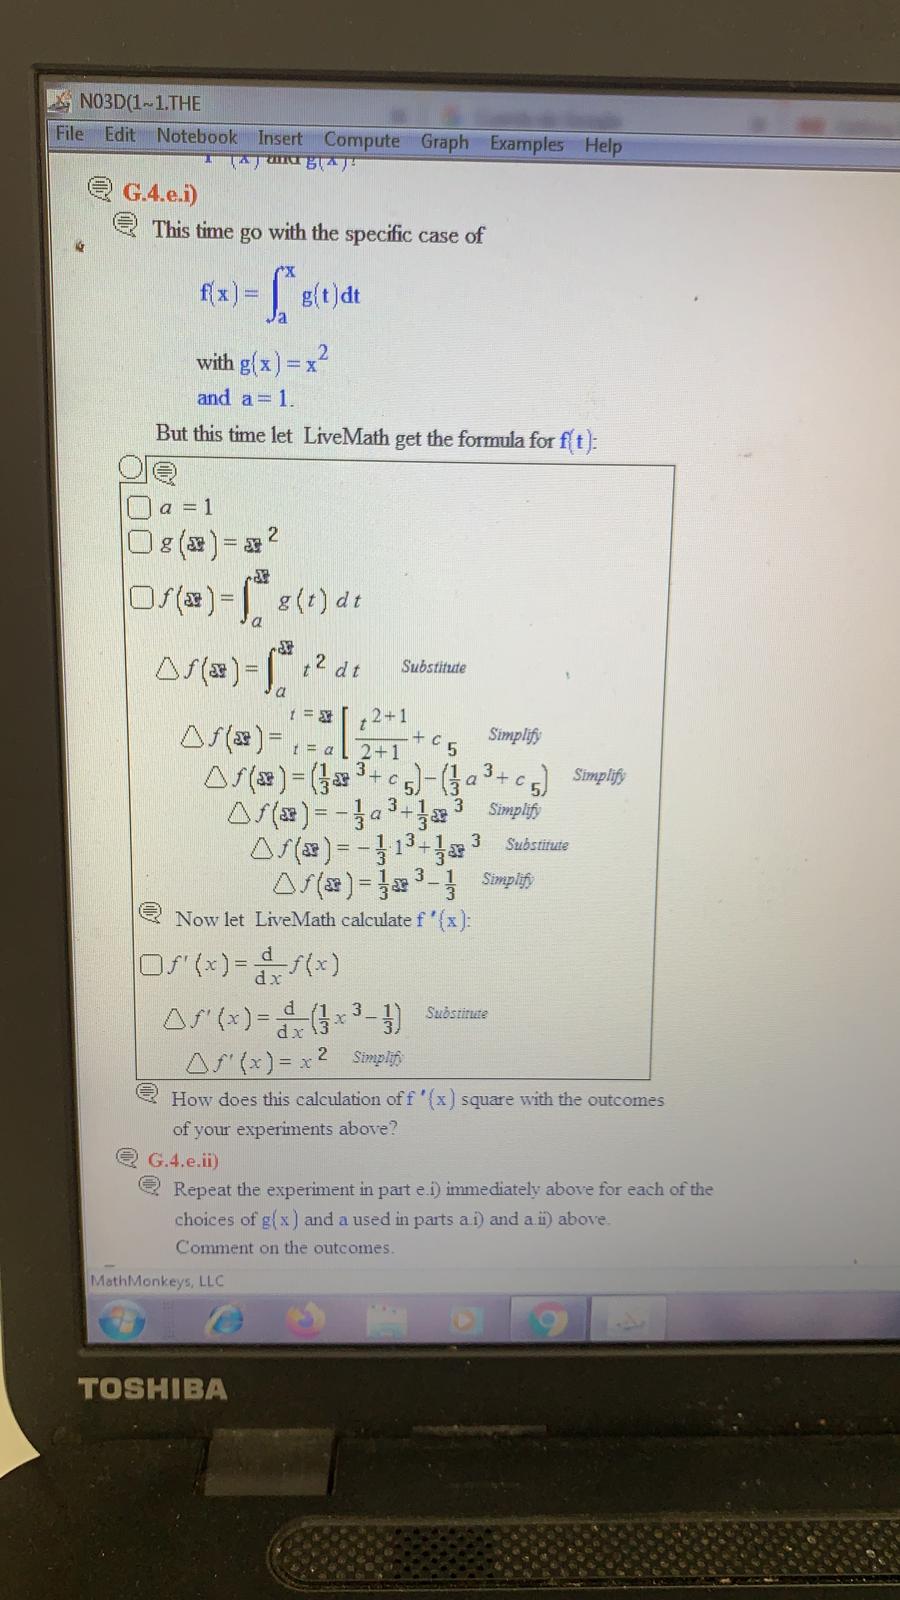
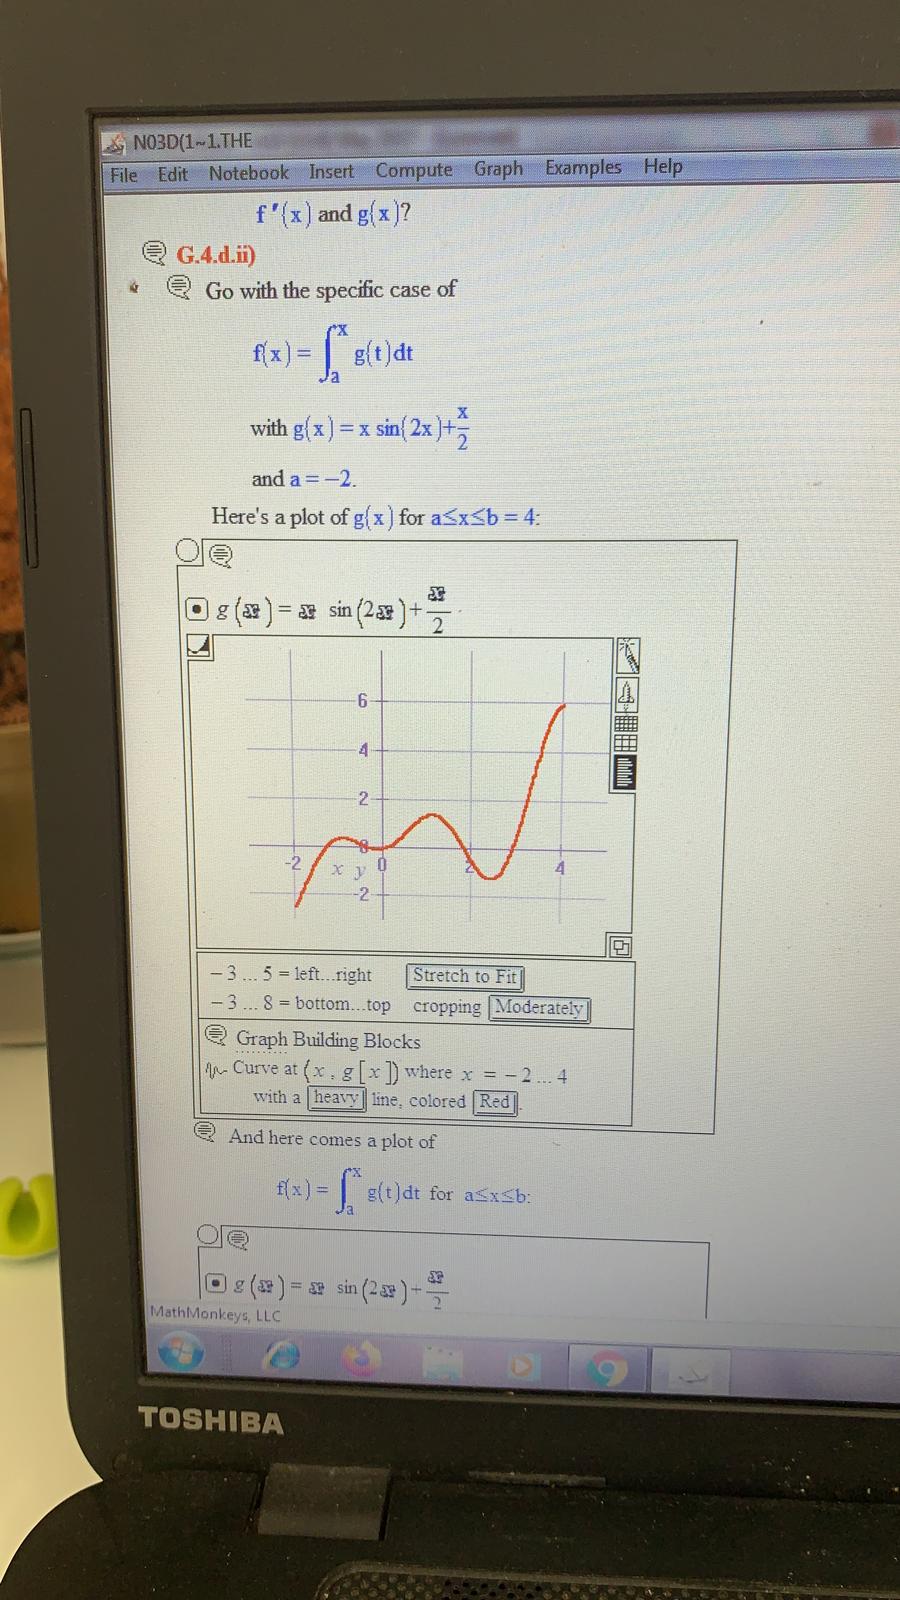
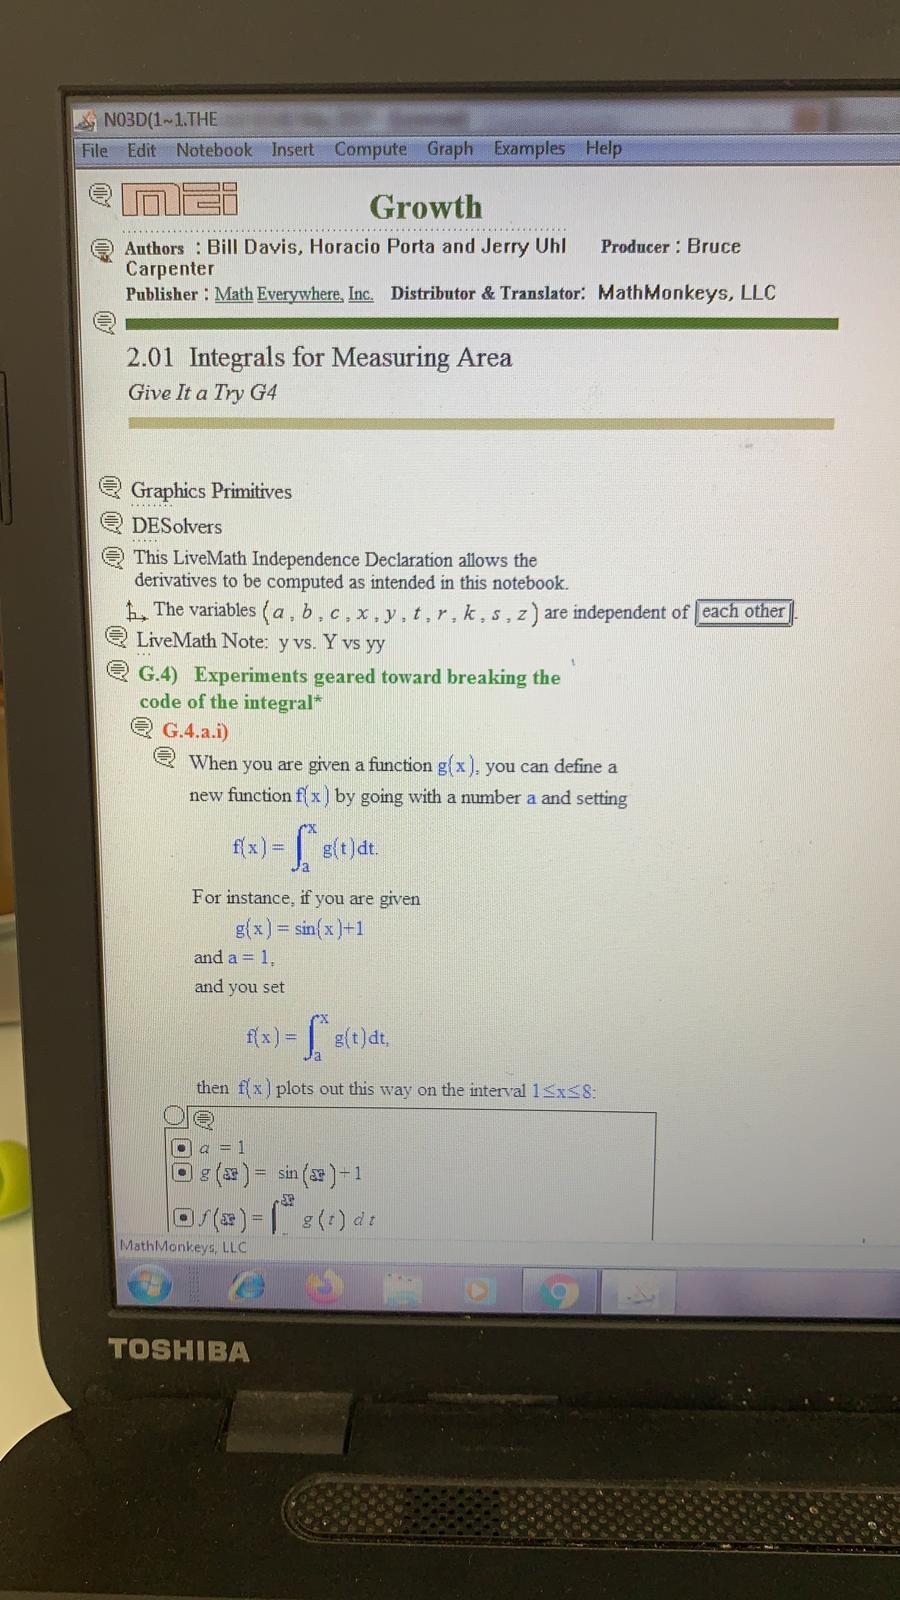
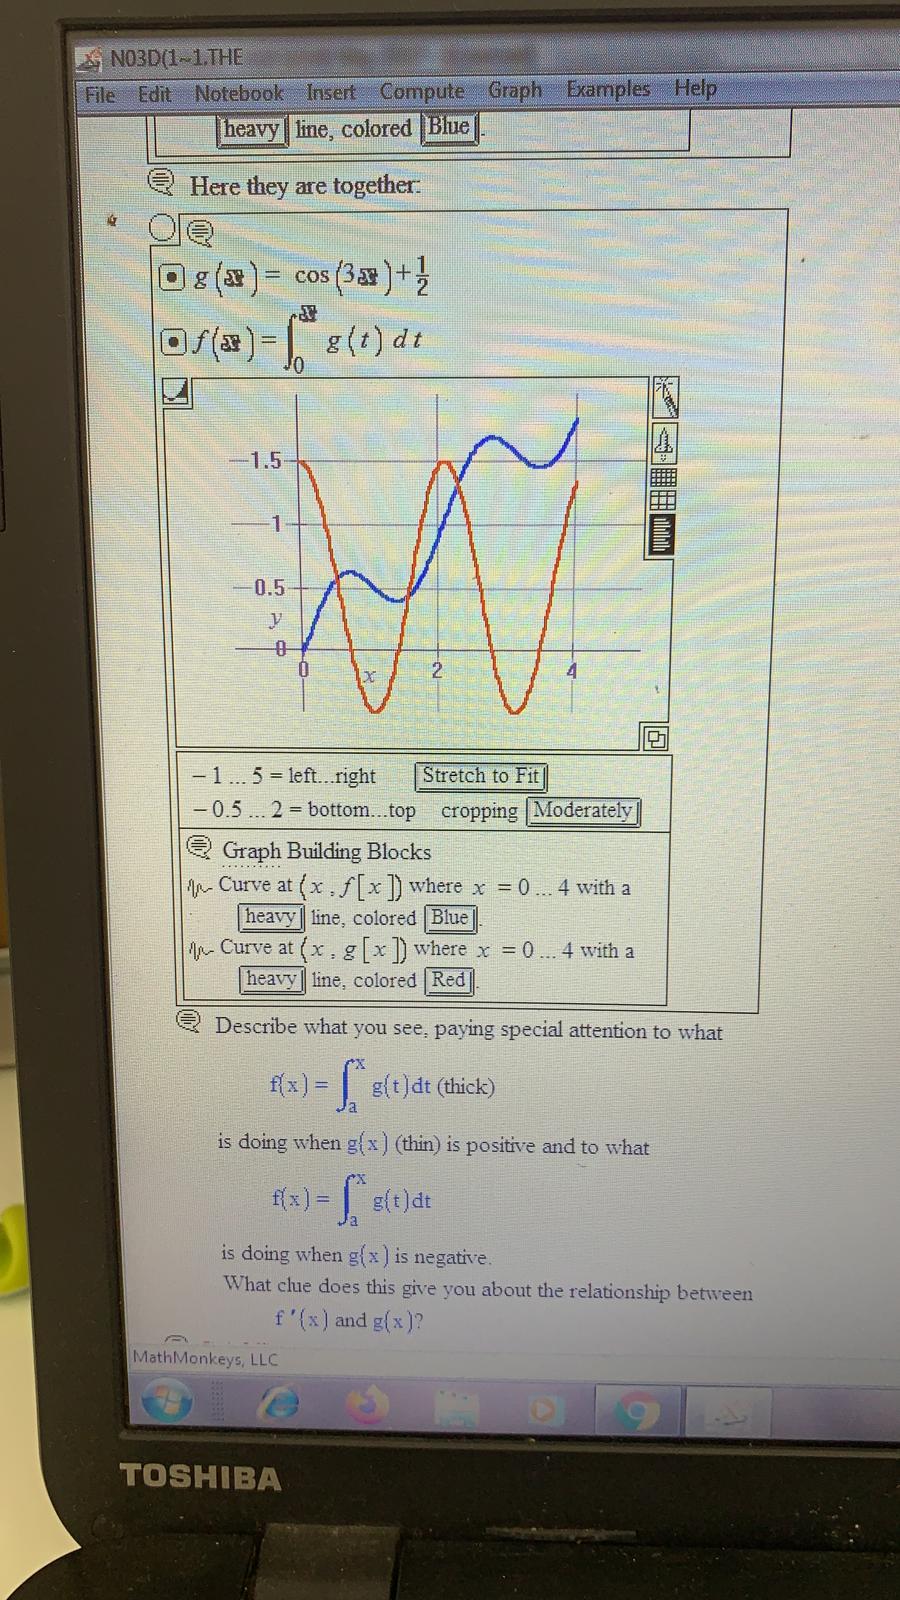
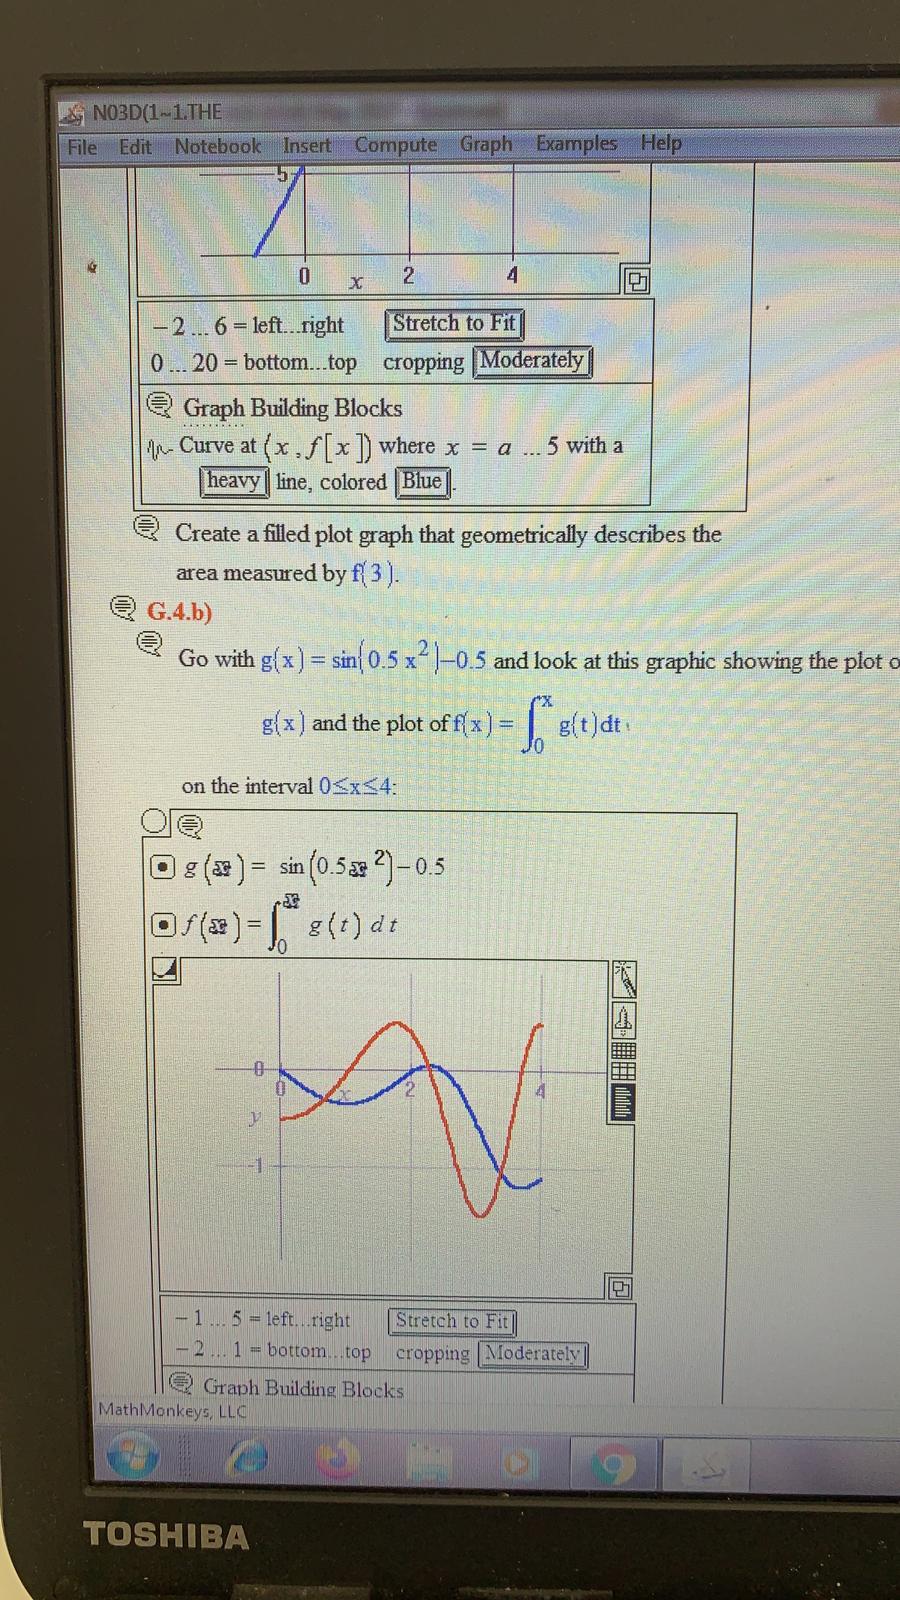
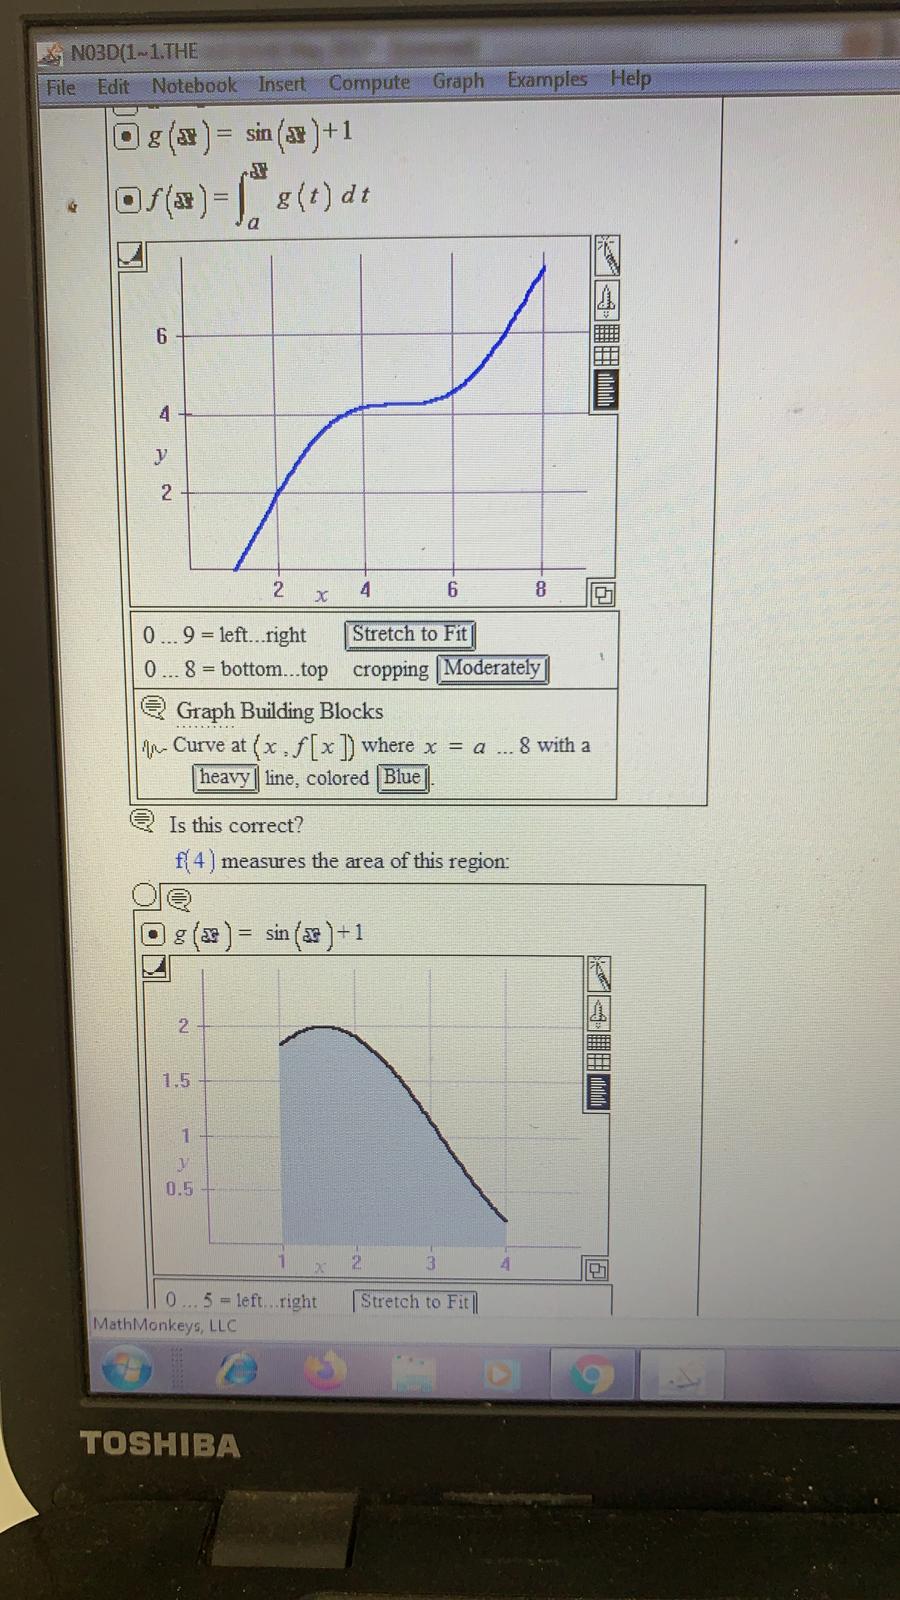
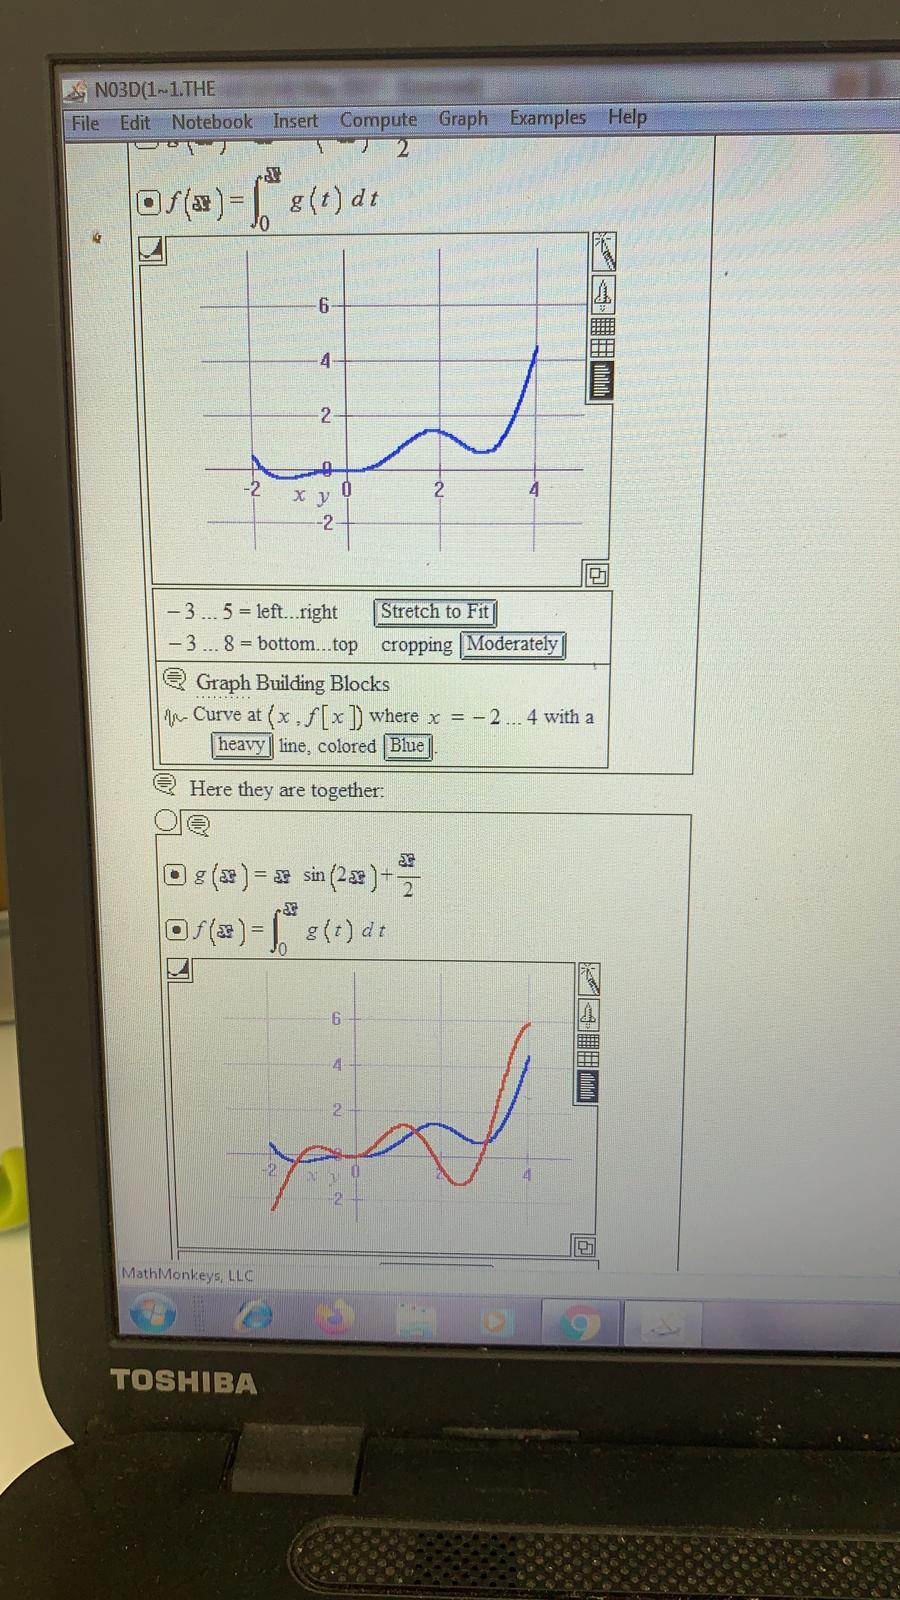
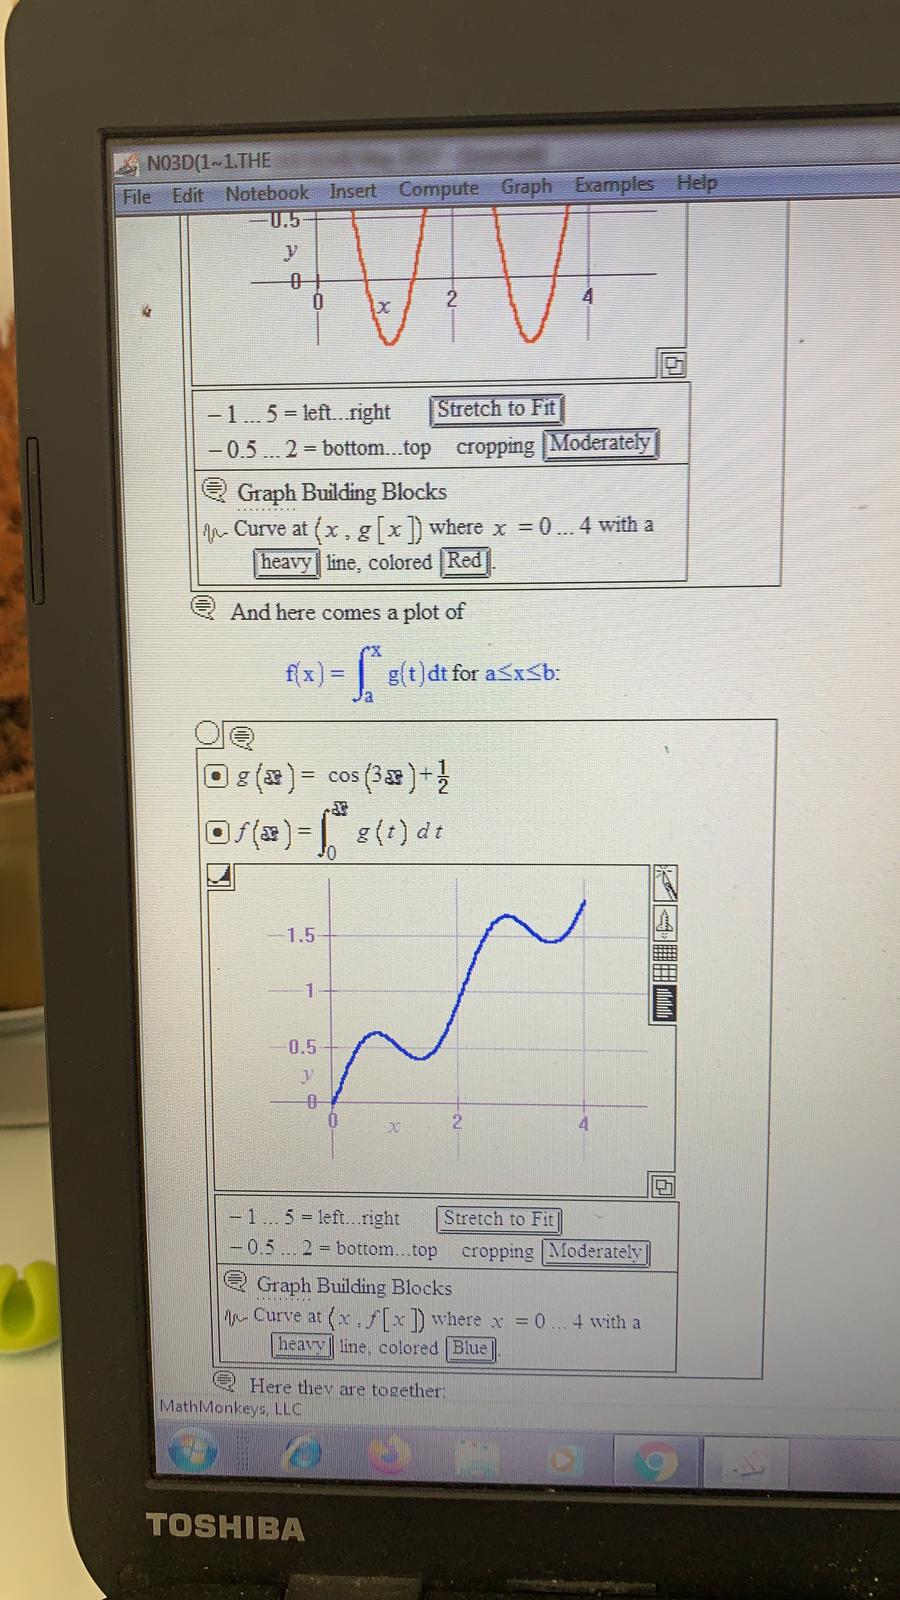
NO3D(1~1. THE File Edit Notebook Insert Compute Graph Examples Help heavy | line, colored |Blue Here they are together. O D g (x ) = cos (328 ) + z of (*) = | 8(t) dt -1... 5 = left...right Stretch to Fit -0.5 ... 2 = bottom...top cropping Moderately Graph Building Blocks In- Curve at ( x , f [x ]) where x =0 ... 4 with a heavy| line, colored Blue In- Curve at (x . g [x ) where x = 0 .. . 4 with a heavy line, colored Red Describe what you see, paying special attention to what f( x ) = | g(t ) dt (thick) is doing when g( x ) (thin) is positive and to what f( x ) = [" =(t)at is doing when g( x ) is negative. What clue does this give you about the relationship between f ' (x ) and g(x)? MathMonkeys, LLC e 9 TOSHIBANO3D(1-1.THE File Edit Notebook Insert Compute Graph Examples Help X - 2... 6 -left..right Stretch to Fit 0 ... 20 - bottom...top cropping Moderately Graph Building Blocks In- Curve at ( x . f [x]) where x = a ... 5 with a heavy | line, colored Blue] Create a filled plot graph that geometrically describes the area measured by f( 3 ). @ G.4.b) Go with g(x ) = sin( 0.5 x /-0.5 and look at this graphic showing the plot g( x ) and the plot of fix ) = | g(t)dt . on the interval 0 sin (238 )+ 2 of (* ) = | 8(t) dt MathMonkeys, LLC TOSHIBANO3D(1~1.THE File Edit Notebook Insert Compute Graph Examples Help -0.5- - 1... 5 = left..right Stretch to Fit - 0.5 ... 2 = bottom...top cropping Moderately Graph Building Blocks An- Curve at (x , g [x ]) where x = 0 ... 4 with a heavy| line, colored Red And here comes a plot of f( x ) = g(t ) dt for axSb: a g (x ) = cos (329 ) + 2 of (*) =| (t) dt -1.5 0.5 0- - 1... 5 = left...right Stretch to Fit 0.5 ... 2 = bottom...top cropping Moderately Graph Building Blocks An Curve at ( x , f [x ]) where x = 0.,. 4 with a heavy | line. colored Blue Here they are together: MathMonkeys, LLC 9 TOSHIBANO3D(1-1.THE File Edit Notebook Insert Compute Graph Examples Help -2 .. 1 = bottom..top cropping |Moderately Graph Building Blocks An- Curve at ( x , f [ x ]) where x = 0 .. 4 with a heavy | line, colored Blue An- Curve at (x , g [x ]) where x = 0 .. 4 with a heavy | line, colored |Red Discuss how you could have known in advance that f(x ) (blue) would be going down when g( x )(red) is negative, but that f( x ) would be going up when g( x ) is positive. @ G.4.c) Mathematica-specific. Skip in LiveMath version. @ G.4.d.i) Experienced integral watchers know how to break the code of the integral. The first step toward breaking the code of the integral is to learn how to calculate ' f' ( x) when f( x ) is given by f( x ) = [ = (t ) at for some other function g( x ). Go with the specific case of f( x) = | g(t)dt with g( x ) = cos( 3x )+7 and a = 0. Here's a plot of g( x ) for axb = 4: a g (x ] = cos (3 30 ] -7 1.5 MathMonkeys, LLC TOSHIBANO3D(1~1.THE File Edit Notebook Insert Compute Graph Examples Help 0 .. 5 = left...right Stretch to Fit 0... 2.5 - bottom...top cropping Moderately Graph Building Blocks Surface at ( x , y ) where x = 1 .. 4 and y =0... g (x ): Illuminated surface has no mesh and is shaded using Solid | coloring; Light Gray| is the solid color. An- Curve at ( x , g [x ]) where x = 1 .. 4 with a heavy line, colored Black Why or why not? @ G.4.a.ii) You are given g(x) = 6.2 2 0.2 x2 and a = -1 and you set f( x ) = \\ "g(t )dt then fix ) plots out this way on the interval -1x$5: Ca=-1 D (*) =62: -0.2x2 of(*) =| g(t) dt 15 10 MathMonkeys, LLC 9 TOSHIBANO3D(1-1.THE File Edit Notebook Insert Compute Graph Examples Help Ta Jand Bua J @ G.4.e.i) This time go with the specific case of fix ) = | g(t)dt with g( x ) = x2 and a = 1. But this time let LiveMath get the formula for f( t ): Da=1 Of (=) =| 8(t) dt Of( 2 ) =1 12 dt Substitute 1 = x 2 2 +1 Of(=) - 1 = 2 2+1* -+ c5 Simplify Of(2) = (63+c5)-(a3+c) Simplify + hae 3 Simplify Of(*)=-413+1 3 Substitute Simplify Now let LiveMath calculate f ' ( x): Of ( x ) = 2 f(x ) Of (x) = =(3x3-3) Substitute Of (x) = x2 Simplifi How does this calculation of f ' (x ) square with the outcomes of your experiments above? @ G.4.e.ii) Repeat the experiment in part e.i) immediately above for each of the choices of g( x ) and a used in parts a i) and a ii) above. Comment on the outcomes. MathMonkeys, LLC TOSHIBANO3D(1-1.THE File Edit Notebook Insert Compute Graph Examples Help f' (x ) and g(x )? @ G.4.d.ii) Go with the specific case of f( x ) = | g(t )dt with g( x ) = x sin( 2x ]+7 and a = -2. Here's a plot of g(x ) for axb = 4: D g (x ) = * sin (238 )+2 -2 X - 3... 5 = left..right Stretch to Fit - 3 ... 8 = bottom...top cropping Moderately 2 Graph Building Blocks An- Curve at ( x . g [x ]) where x = - 2...4 with a heavy line, colored Red And here comes a plot of f(x) = | g(t ]dt for asxsb: ge O ga) = > sin (2: ) + MathMonkeys, LLC 9 TOSHIBANO3D(1-1.THE File Edit Notebook Insert Compute Graph Examples Help 3 ... 5 =left..right Stretch to Fit 3 ... 8 = bottom...top cropping Moderately Graph Building Blocks An- Curve at ( x , f [x ]) where x - - 2... 4 with a heavy| line, colored Blue 1- Curve at (x , g [ x]) where x = - 2... 4 with a heavy| line, colored |Red Describe what you see, paying special attention to what f( x ) = \\ g(t )dt (thick) is doing when g(x ) (thin) is positive and to what is doing when g( x ) is negative. What clue does this give you about the relationship between f ' (x ) and g(x)? @ G.4.d.iii) Make up your own function g( x ] and your own choices of a and b and run the same experiment. Try to use a function g( x ) that has both positive and negative values for different x's with axb. Describe what you see, paying special attention to what f( x ) = \\"g(t ) at is doing when g( x ) is positive and to what f( x ) = =(t) dt is doing when g( x ) is negative What clue does this give you about the relationship between f ' ( x ) and g(x )? MathMonkeys, LLC TOSHIBANO3D(1~1. THE File Edit Notebook Insert Compute Graph Examples Help mei Growth Authors : Bill Davis, Horacio Porta and Jerry Uhl Producer : Bruce Carpenter Publisher : Math Everywhere, Inc. Distributor & Translator: MathMonkeys, LLC 2.01 Integrals for Measuring Area Give It a Try G4 2 Graphics Primitives DESolvers This LiveMath Independence Declaration allows the derivatives to be computed as intended in this notebook. The variables ( a . b , c . x . y , t, r , k , s , z ) are independent of each other LiveMath Note: y vs. Y vs yy @ G.4) Experiments geared toward breaking the code of the integral* @ G.4.a.i) When you are given a function g( x ), you can define a new function f( x ) by going with a number a and setting f( x ) = \\"s(t) at. For instance, if you are given g(x ) = sin(x )+1 and a = 1, and you set f( x ) = [ =(t)dt. then fix ) plots out this way on the interval 1


![f [x ]) where x =0 ... 4 with a heavy| line,](https://dsd5zvtm8ll6.cloudfront.net/si.experts.images/questions/2024/10/670905e158d29_577670905e13716b.jpg)