

Question: Nonlinear Correlation No Correlation Question 15 1 Point When would you need to use the average of the y-values to make a prediction instead of

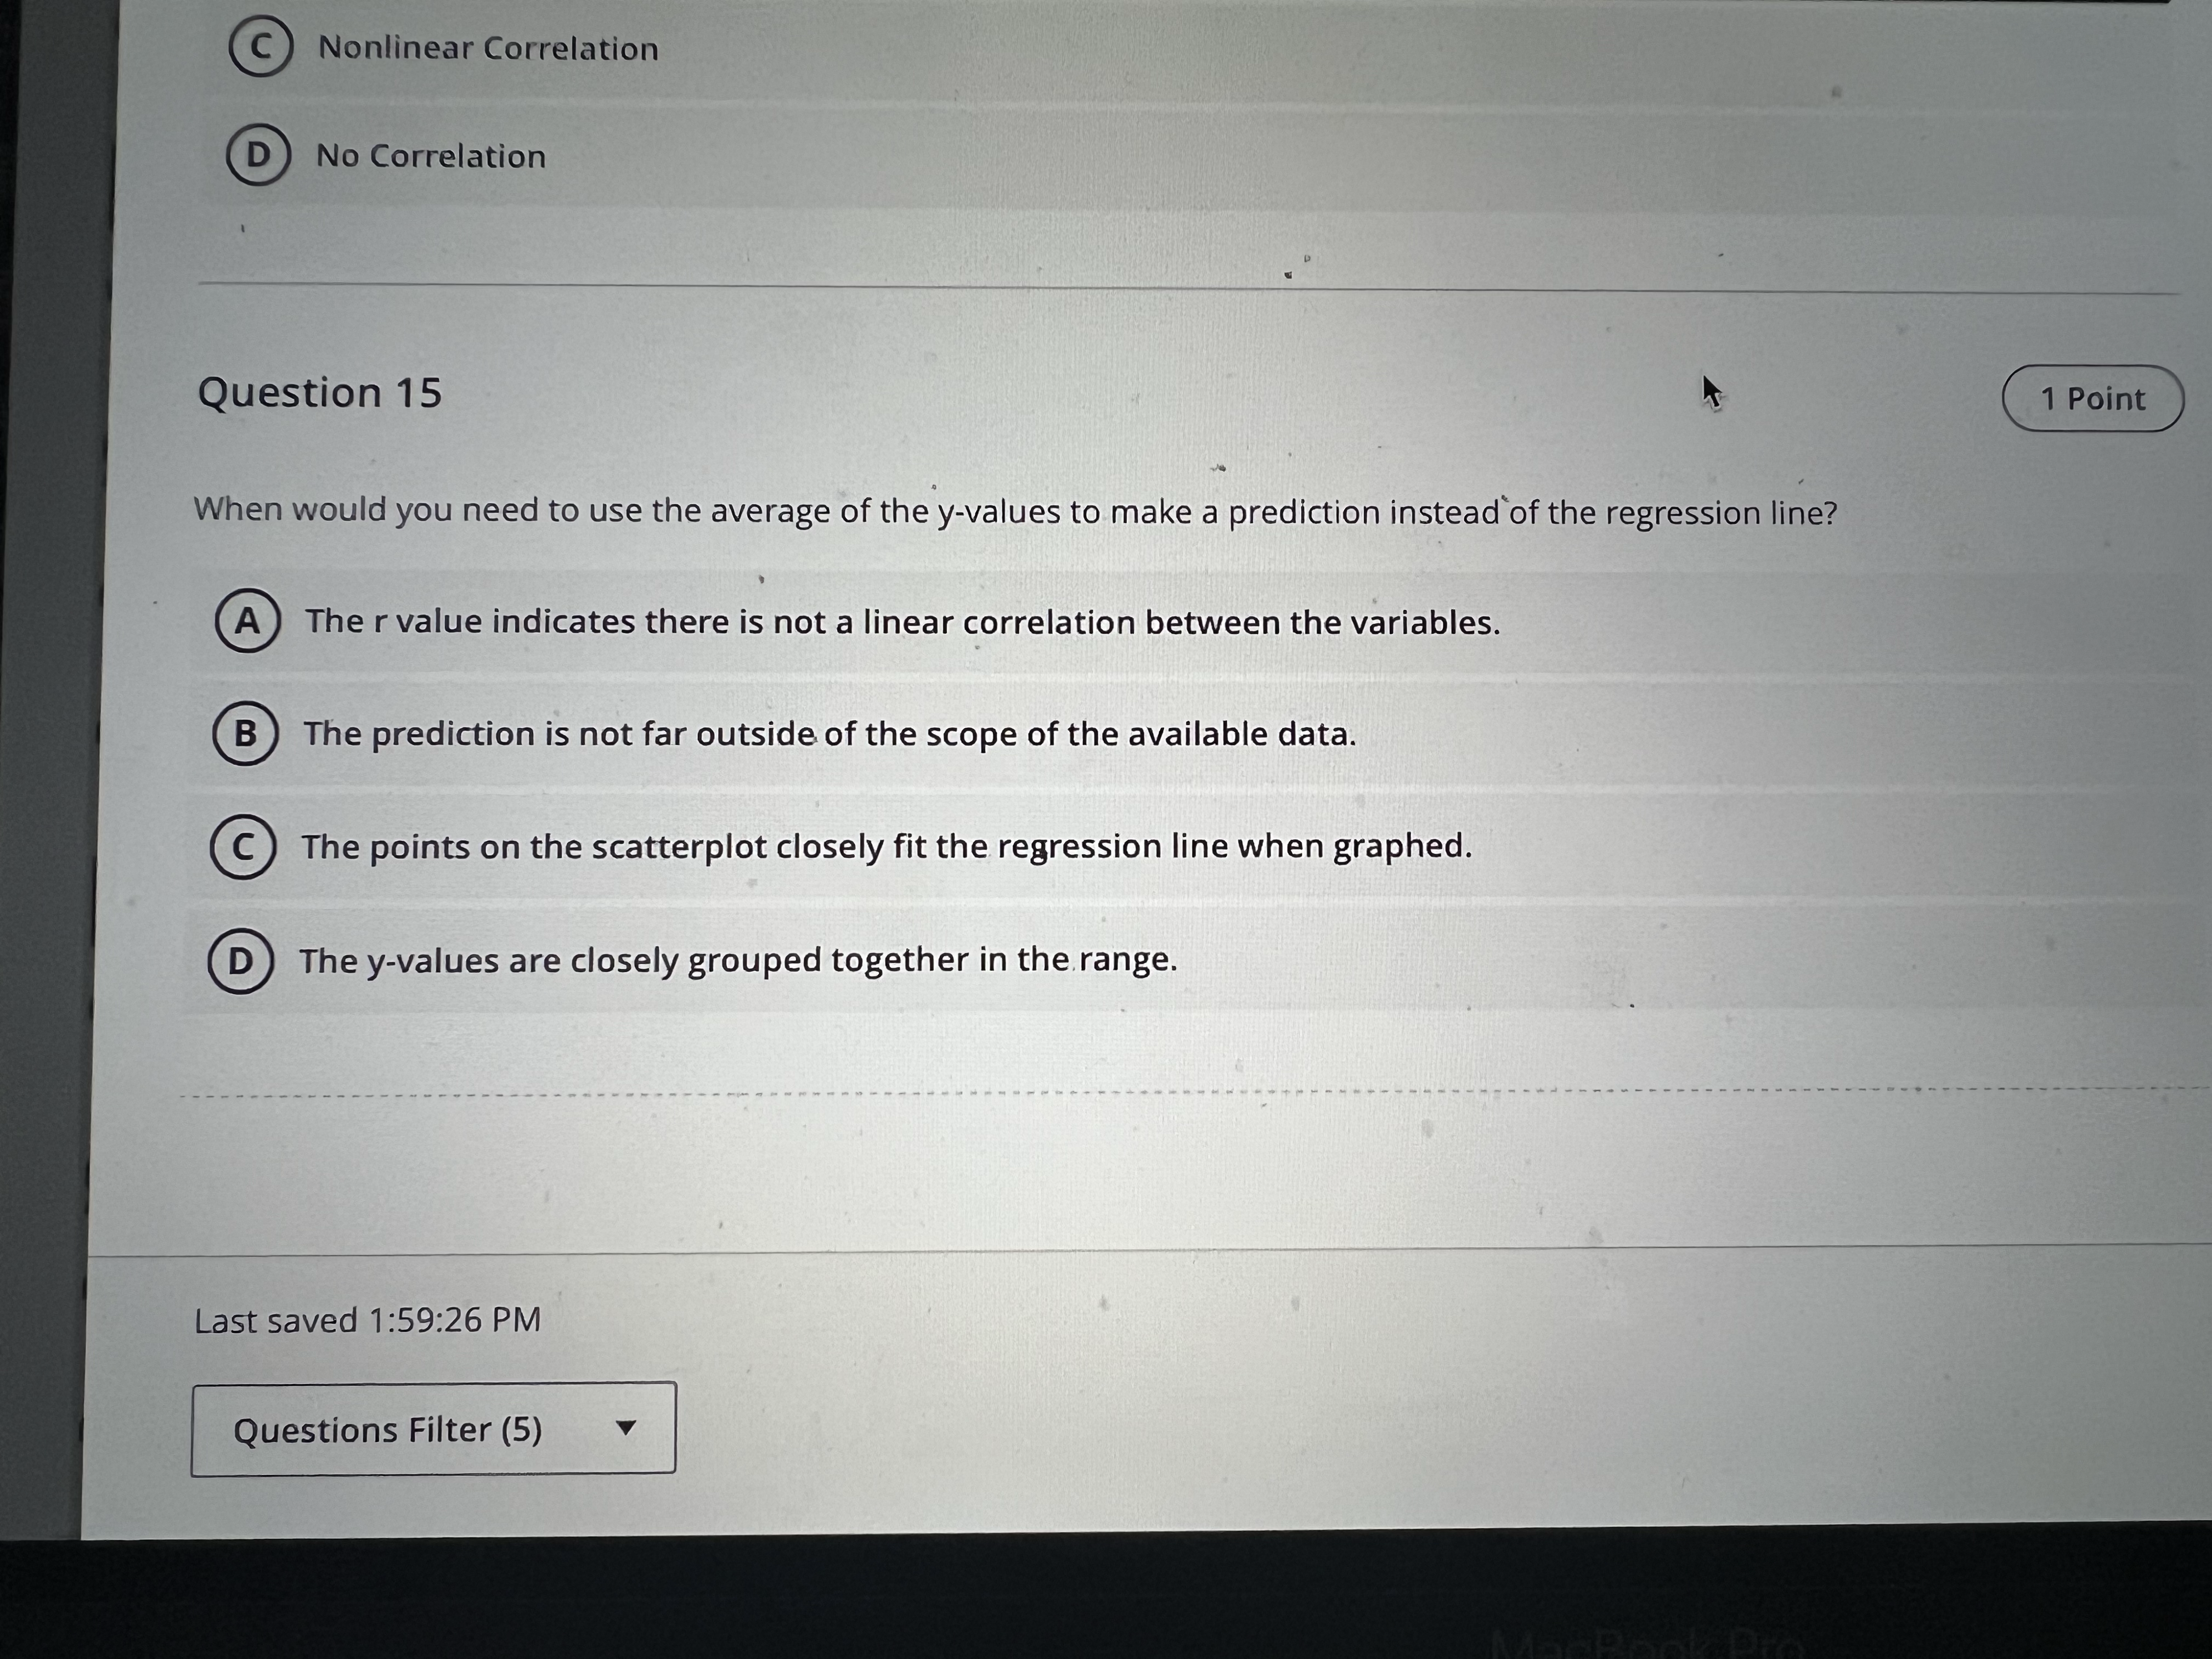
Nonlinear Correlation No Correlation Question 15 1 Point When would you need to use the average of the y-values to make a prediction instead of the regression line? The r value indicates there is not a linear correlation between the variables. B The prediction is not far outside of the scope of the available data. C The points on the scatterplot closely fit the regression line when graphed. D The y-values are closely grouped together in the range. Last saved 1:59:26 PM Questions Filter
Step by Step Solution
There are 3 Steps involved in it
1 Expert Approved Answer
Step: 1 Unlock

Question Has Been Solved by an Expert!
Get step-by-step solutions from verified subject matter experts
Step: 2 Unlock
Step: 3 Unlock