

Question: Normal Distribution Portfolio Directions: In Unit 6 we are studying Normal Distribution (finding the mean, Standard Deviation, determining if a graph is Normally Distributed or
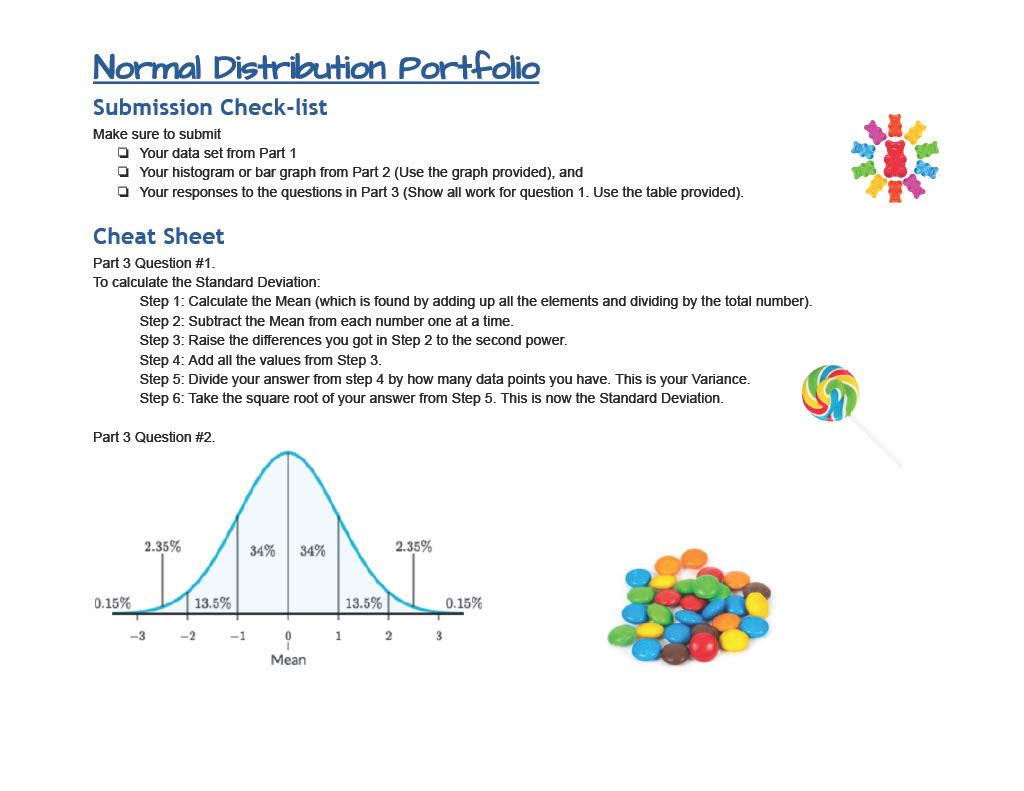
Normal Distribution Portfolio Directions: In Unit 6 we are studying Normal Distribution (finding the mean, Standard Deviation, determining if a graph is Normally Distributed or not, etc.). We will want to either use the data provided or collect our own. And our goal is to analyze the characteristics of a distribution. Be sure to show all work and math calculations (especially on Part 3 #1). *Please watch the following recording for assistance: https//www.loom.com/share/996c08cf730149acbcode45560705637 Also note that the data values will not match. This video is more for assistance on how to complete the assignment. Part 1 You are to collect a set of data with at least 30 data points (it can be more but we recommend using 30). Make sure the data (if you decide to collect your own) can be measured quantitatively, in other words it can be measured with numbers. the lengths (heights) of newborn babies the number of free throws taken by different professional basketball players in a season . . the number of pages in various magazines Or you can use the data below: Pieces of candy eaten by 30 people over the span of a month: 10, 5, 8, 9, 8, 11, 14, 8, 3, 12, 7, 5, 8, 6, 9, 10, 7, 6, 12, 7, 8, 9, 4, 9, 11, 6, 13, 10, 8, 7 Enter your data below or state if you will use the provided 'Candy Eaten' dataNormal Di9+riouon Perl-Polio Part 2 Next you will create a visual representation of your data. It the data is continuous, use a histogram. If the data is discrete, use a bar graph. Make sure to label the axes with appropriate titles and incorporate the appropriate scale on each axis. Use the graph paper provided below or your own it you prefer. Please also read the following two notes... Note #1: On the yaxis {up and down.) this is the height of your data. In other words, suppose you used the 'Candy Eaten' data and looked at the frequenqlr o'lthe riLl'nber 8. Notice it appears six times in our data. So it would have a height o'l six. Note #2: Be sure to properly label your xandy axes on the graph below. Normal Distribution Portfolio Part 3 Respond to the following questions. Show all work. (See Page 3 for "Cheat Sheet") x x - m (x - m)2 1. What is the Mean and Standard Deviation of the set of data? To show your calculations for the Standard Deviation fill out the table to the right: (In the table, the first column should be your 30 data points represented by the variable x. And m refers to the mean.) Mean: Standard Deviation: 2. Does the data follow a Normal Distribution? Be sure to mathematically justify your answer (In other words: How does it compare to the percentages of a "bell curve". See page 3 for graph) Explanation: 3. Answer one of the following questions. a. If your sample follows a Normal Distribution..how did you know? Explain. b. If your sample does not follow a Normal Distribution (e.g., it could be skewed left or right, have a Uniform Distribution, or have some other shape), then why might this be the reason? Explanation:Normal Distribution Portfolio Submission Check-list Make sure to submit Your data set from Part 1 O Your histogram or bar graph from Part 2 (Use the graph provided), and Q Your responses to the questions in Part 3 (Show all work for question 1. Use the table provided). Cheat Sheet Part 3 Question #1. To calculate the Standard Deviation: Step 1: Calculate the Mean (which is found by adding up all the elements and dividing by the total number). Step 2: Subtract the Mean from each number one at a time. Step 3: Raise the differences you got in Step 2 to the second power. Step 4: Add all the values from Step 3. Step 5: Divide your answer from step 4 by how many data points you have. This is your Variance. Step 6: Take the square root of your answer from Step 5. This is now the Standard Deviation. Part 3 Question #2. 2.35% 34% 34% 2.35% 0.15% 13.5% 13.5% 0.15% -3 -2 -1 2 Mean
Step by Step Solution
There are 3 Steps involved in it

Get step-by-step solutions from verified subject matter experts