

Question: Normal distribution tables and T-tables listed below if needed questions are last picture thank you!! A report states that adults 18- to 24- years-old send
Normal distribution tables and T-tables listed below if needed questions are last picture thank you!!
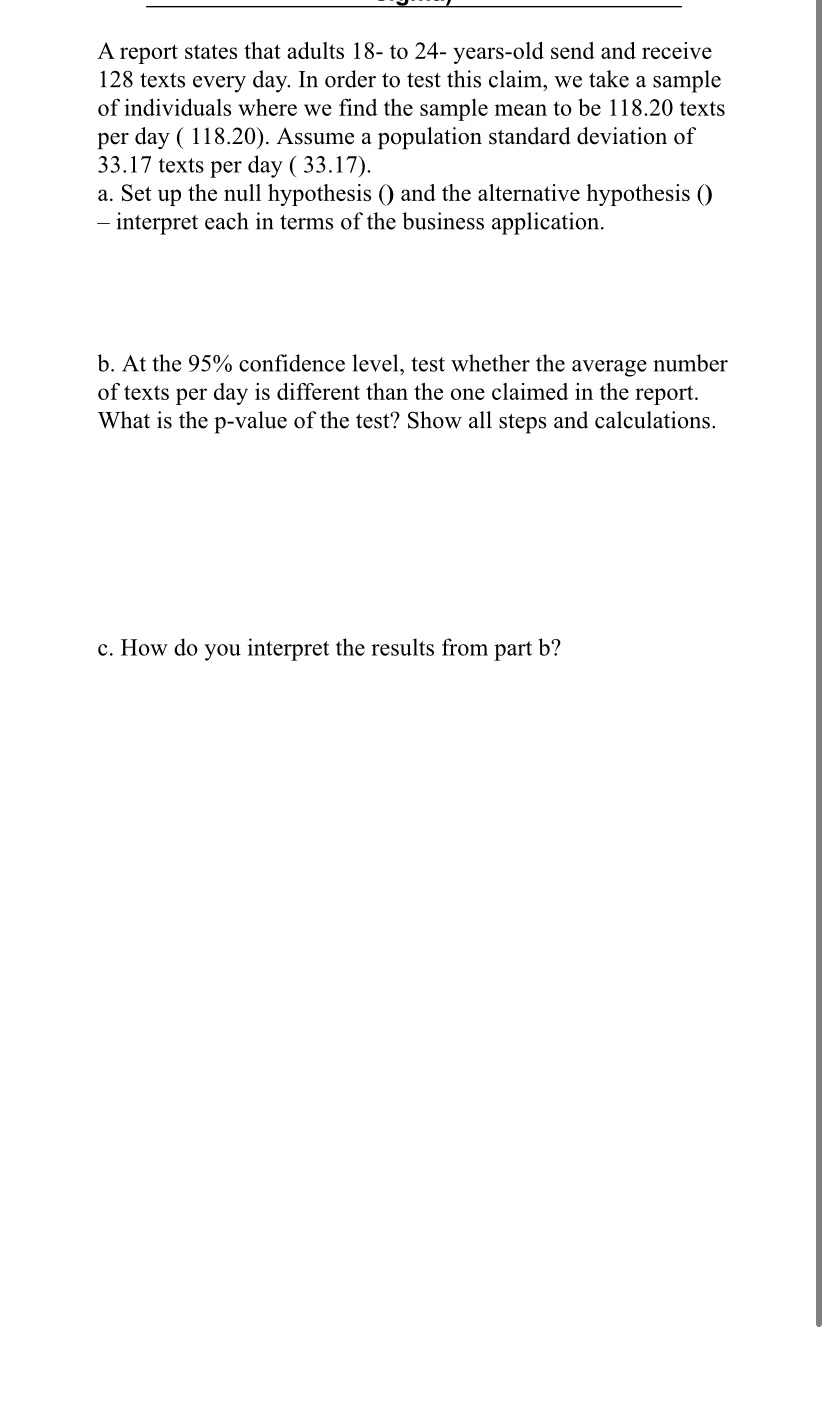
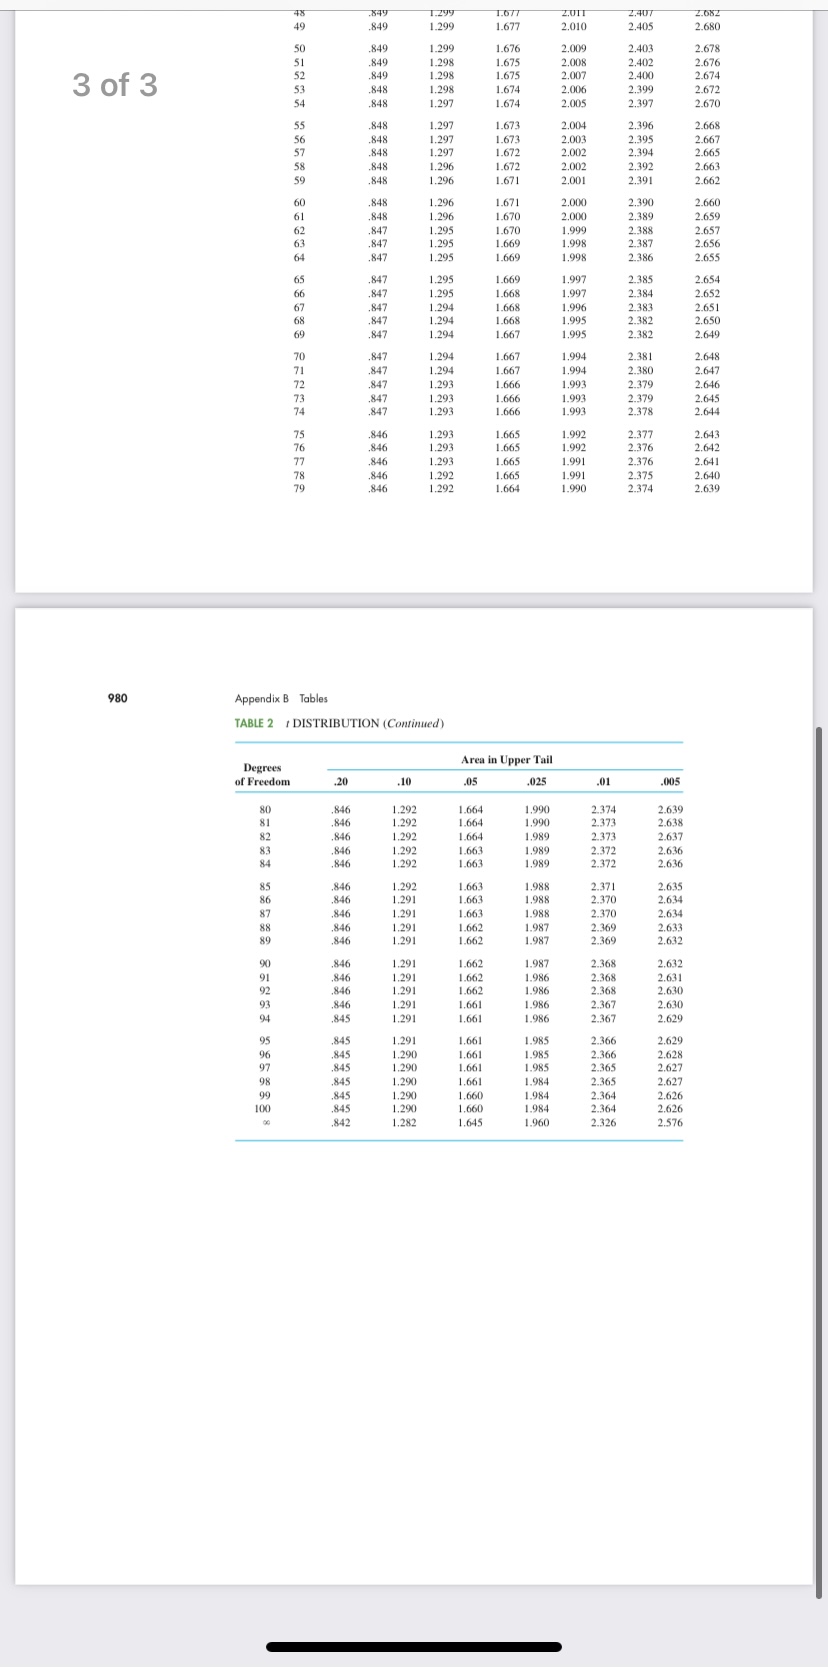
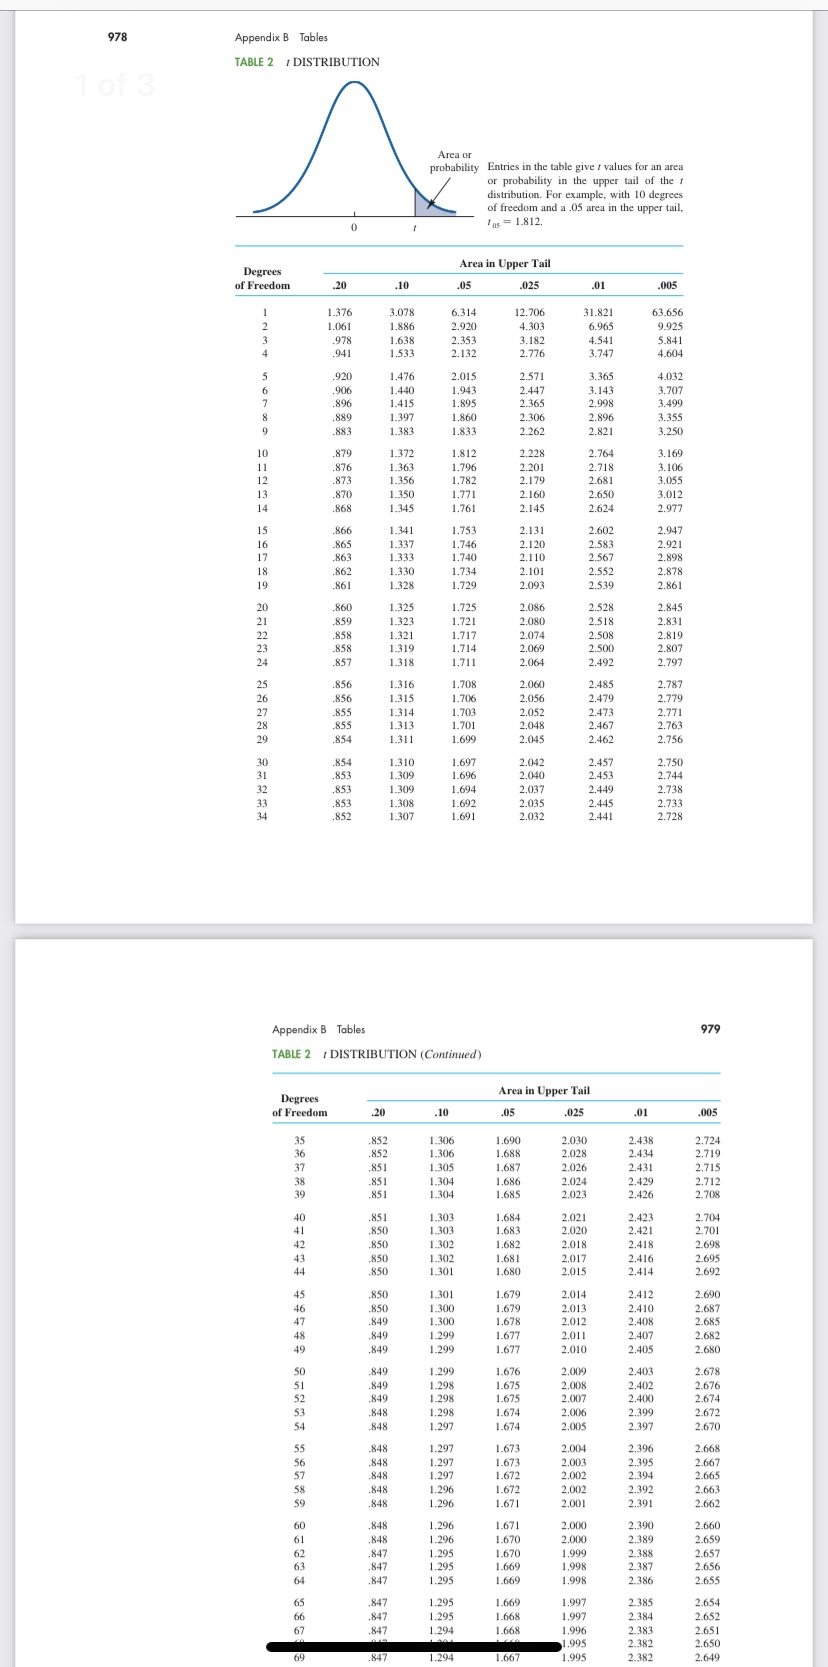
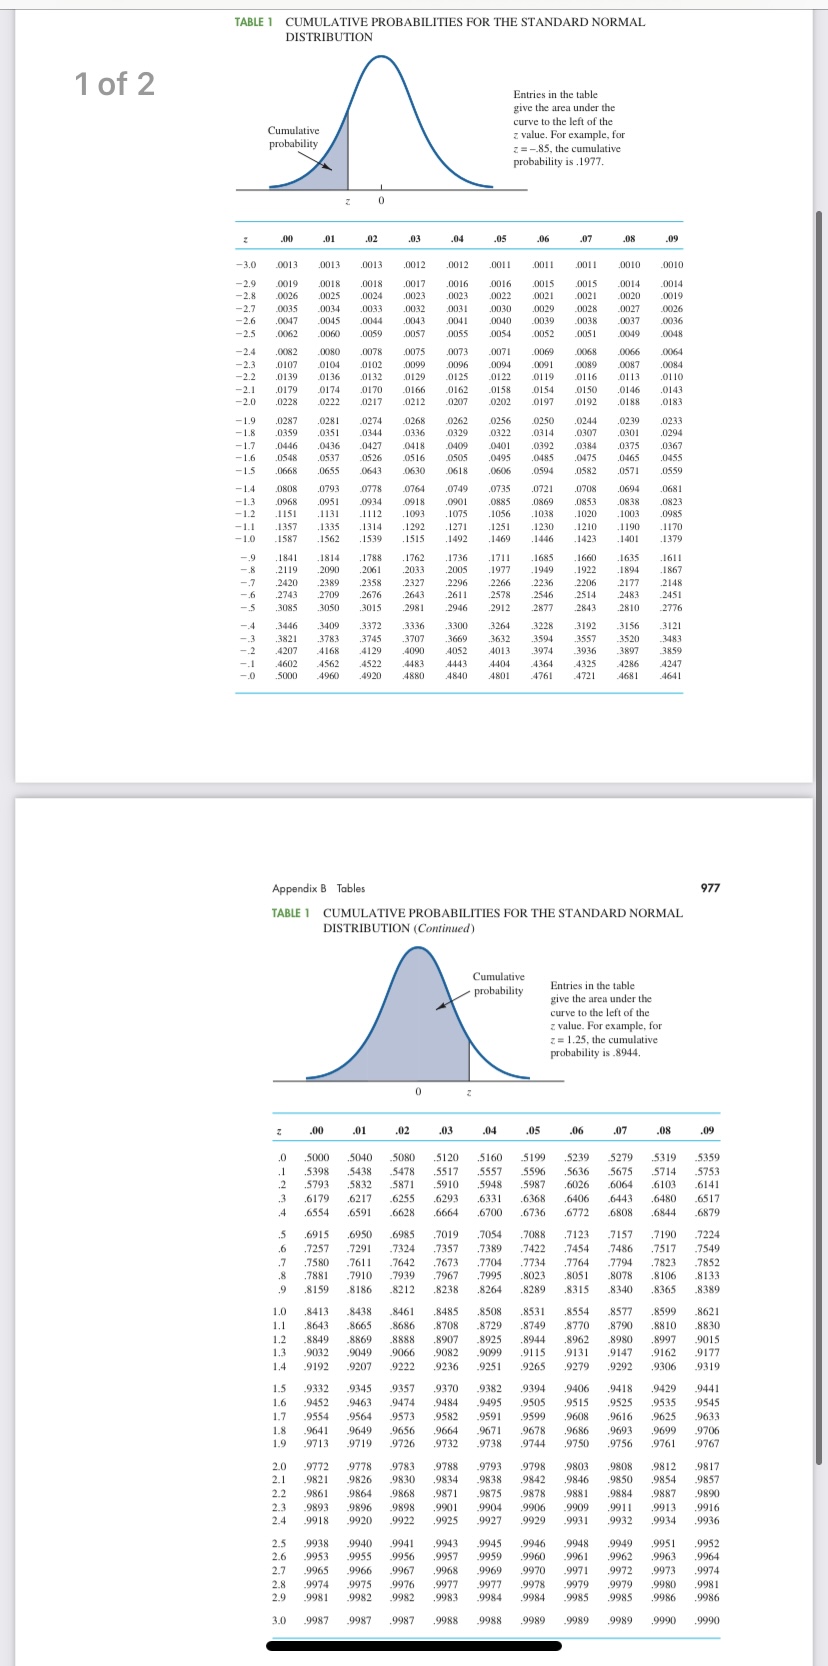
A report states that adults 18- to 24- years-old send and receive 128 texts every day. In order to test this claim, we take a sample of individuals where we nd the sample mean to be 118.20 texts per day ( 118.20). Assume a population standard deviation of 33.17 texts per day ( 33.17). a. Set up the null hypothesis 0 and the alternative hypothesis 0 interpret each in terms of the business application. b. At the 95% condence level, test Whether the average number of texts per day is different than the one claimed in the report. What is the p-Value of the test? Show all steps and calculations. 0. How do you interpret the results from part b? 1.67 4:407 2.682 .849 1.299 1.677 2.010 2.405 2.680 .849 1.299 1.676 2.009 2.403 2.678 849 1.298 1.675 2.008 2.402 2.676 3 of 3 .849 1.298 1.675 2.400 .848 1.298 1.674 2.006 2.399 2.672 848 1.297 2.397 .848 1.673 2.004 2.668 .848 1.297 1.673 2.003 2.395 2.667 .848 1.297 1.672 2.002 2.394 2.665 848 1.296 1.672 2.002 2.663 848 1.296 1.671 2.001 2.662 .848 1.296 2.000 2.390 2.660 .848 1.296 1.670 2.000 2.389 2.659 .847 1.670 1.999 2 388 2.657 .847 1.295 1.669 1.998 2.387 2.656 847 1.665 1.998 2.386 2.655 .847 1.295 1.669 1.997 2.385 2.654 .847 1.295 1.668 1.997 2.384 2.652 .847 1.294 .847 1.294 1.668 2.382 .847 2.649 .847 1.294 1.667 1.994 2.381 2.648 .847 1.294 1.667 1.994 2.380 2.647 847 1.293 1.66 1.993 2.379 2.646 .847 1.293 1.993 2.379 847 1.293 1.993 2.644 .846 1.293 1.665 1.992 2.377 2.643 .84 1.293 1.66 1.992 2.376 2.642 .84 1.293 1.665 1.991 2.376 2.641 .846 1.292 1.665 1.991 2.375 2.640 846 1.292 1.664 2.374 2.639 980 Appendix B Tables TABLE 2 DISTRIBUTION (Continued) Area in Upper Tail of Freedom .20 .10 .025 .005 .846 1,292 1.664 1.990 2.374 2.639 .846 1.292 1.664 1,990 2.373 2.638 .846 1.292 1.989 2.373 2.637 83 .846 1.292 1.663 1,989 84 .846 2.636 85 .846 1.292 1.663 1.988 2.371 2.635 86 .846 ,291 1.663 .988 2.370 2.634 .846 1.291 1.663 1.988 2.63 .846 1.291 1.662 1.987 2.369 2.633 846 1.291 1.987 2.632 .846 1.291 1.662 1.987 2.368 2.632 .846 1.291 1.662 .986 2.368 2.631 .846 1.291 1.986 2.630 .846 1.291 1.661 1.986 2.367 2.630 .845 1.291 1.986 2.367 2.629 .845 1.291 1.985 2.366 2.629 .845 1.290 1.661 1.985 2.628 .845 1.290 1.661 1.985 2.365 2.627 .845 1,290 2.365 2.627 .845 1.290 1.660 1.984 2.364 2.626 .845 1.290 1,660 1.984 2.364 2.626 842 1.282 1.645 1.960 2.326 2.576978 Appendix B Tables TABLE 2 / DISTRIBUTION Area or probability Entries in the table give / values for an area or probability in the upper tail of the r distribution. For example, with 10 degrees Degrees Area in Upper Tail .20 .10 .05 .025 005 1.376 1.061 4.303 6.965 9.92 978 1.638 2.353 3.182 4.541 5.841 .941 1.533 2.132 2.776 3.747 4.604 2.01 2.571 3.365 4.03 .906 3.143 3.707 .896 3.499 .889 1.860 2.896 3.355 .883 2.262 2.821 3.250 2.228 2.764 3.169 .876 1.796 2.201 2.718 3.106 2.179 2.681 3.055 .870 1.771 .868 1.76 2.145 2.624 2.97 .866 1.753 2.131 2.602 2.947 .865 1.337 1.746 2.120 2.583 2.921 .863 1.333 1.740 2.110 2.567 2.898 862 1.330 1.734 2.101 2.552 2.878 861 .860 .859 1.323 1.721 2.080 2.518 2.831 .858 1.321 1.717 2.819 .858 1.319 1,714 2.069 2.500 2.807 .857 1.318 1.711 2.492 2.797 2.060 2.485 .856 1.706 2.479 2.779 .855 1.314 1.703 2.473 2.771 .855 1.313 1.70 2.048 2.467 2.763 854 2 462 2.756 .854 1.697 2.042 2.457 2.750 .853 1.309 1.696 2.040 2.453 2.744 2.037 2.449 .853 1.308 1.692 2.035 2.445 2.733 2.728 Appendix B Tables TABLE 2 / DISTRIBUTION (Continued) Degrees Area in Upper Tail of Freedom .20 .10 05 .025 .01 005 35 1.690 2.030 2.724 36 1.306 1.688 2.028 2.434 2.719 37 .851 1.68 2.026 2.715 38 .851 1.304 1.686 2.024 2.429 2.712 39 2.023 2.426 40 .851 2.021 2.704 41 .850 1.303 2.020 2.421 2.701 2.018 2.418 2.698 1.302 .850 1.679 2.014 2.412 2.690 .850 1.300 1.67 2.013 2.410 2.687 .849 1.67 2.012 2.408 2.685 .849 1.299 2.011 2.407 2.682 1.676 .849 1.298 1.675 2.008 2.676 .849 1.298 1.675 2.400 .848 1.298 1.674 2.006 2.399 .848 1.297 2.005 2.670 2.004 2.668 2.003 2.667 2.394 .848 1.296 1.672 2.002 2.392 2.663 .848 2.001 2.662 .848 1.296 2.000 2.390 2.660 .848 1.296 2.000 2.389 2.659 .847 1.295 1.999 2.388 2.657 .847 2.655 .847 1.295 1,997 2.654 847 1.668 1.997 2.384 2.652 67 .847 1.294 1.668 1.996 2.383 2.651 .995 2.382 2.650 69 1.294 2.382 2.649TABLE 1 CUMULATIVE PROBABILITIES FOR THE STANDARD NORMAL DISTRIBUTION 1 of 2 Entries in the table give the area under the Cumulative z value. For example, for probability is .1977. -00 .01 .05 .0013 .001 0012 0017 0016 .0016 .0015 0014 .0014 -2.9 0019 DDIS .0018 0021 0020 0026 0025 0023 .0023 0022 0021 0029 0035 0031 DO30 0044 3075 .0073 DO71 DO66 .0107 010 0102 0090 0096 DO9 10089 0087 0228 0217 .0207 020)2 188 .0183 .0294 M418 0526 0516 .0503 0475 0465 .0455 .0548 0495 0571 .0559 0668 .0655 0630 0694 0808 0934 0838 .0968 0918 .0853 1020 1003 1151 1093 1056 1314 1292 1251 1230 1210 1190 1401 1660 1635 1841 1922 1894 .1867 2119 2090 .206] 2033 .2005 1977 1949 .2420 2358 2327 2296 2266 2236 2206 2177 2148 .2743 .2076 2643 2483 2810 .3336 3192 3121 .3446 .3372 3300 3264 3228 3156 3821 .3783 3745 3707 .3669 3632 .3557 3520 4013 5000 -4960 4880 .4840 4801 Appendix B Tables TABLE 1 CUMULATIVE PROBABILITIES FOR THE STANDARD NORMAL DISTRIBUTION (Continued) Cumulative probability Entries in the table give the area under the curve to the left of the z value. For example, for .05 .5714 5753 .5398 -5478 5517 .5636 6103 6179 6255 6293 6368 6554 .659 6700 6844 .6915 6950 6985 .7088 7123 7157 .7190 7224 .7324 .7549 .7257 7611 -7642 .7673 .7704 .7764 .7823 .7852 7910 .8106 ,7881 .7967 8023 8133 .8365 8621 10 8413 8438 8485 8508 8599 8643 866 8749 ,8810 8849 9032 9049 9082 9162 9345 .9394 9418 .9332 9357 9370 9545 1.6 9452 9463 9474 9484 951 9525 9535 9564 9582 960 9616 9625 9633 9649 9664 9686 9693 9699 9715 9720 .9744 9756 9761 9788 9812 .9772 .9798 .9803 9808 9864 988 9887 9901 9906 991 1 9913 9916 9893 9896 9898 9918 9922 9925 9929 993 9932 9934 9938 9940 9941 .9943 9946 .9948 9949 9951 .9952 9953 995 995 9966 9968 .9970 997 9978 9980 9981 9974 997 9976 9985 9986 9981 9982 .9988 9988 9989 9989 9989 9990 9990 9987
Step by Step Solution
There are 3 Steps involved in it

Get step-by-step solutions from verified subject matter experts