

Question: Normalization Activity Assignment #2 spreadsheet. The data reflect that a professor can have multiple advisees, can ournal. e been given the table structure and data
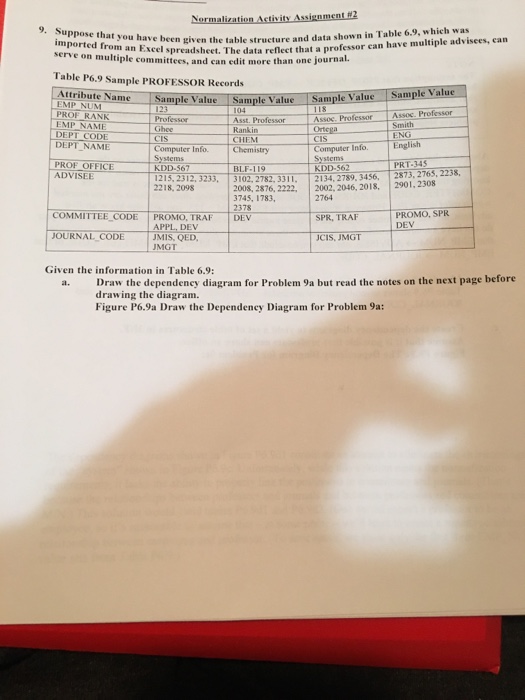


Normalization Activity Assignment #2 spreadsheet. The data reflect that a professor can have multiple advisees, can ournal. e been given the table structure and data shown in Table 6.9, which was imported from an Excel serve on multiple committees, and can edit more than one 1 Table P6.9 Sample PROFESSOR Records Attribute Name EMP NUM PROF RANK Sample Value Sample Value Sample Value mple Value Assoc. Professor Smith ENG Assoc Ortega CIS Computer Info. English Systems KDD-56 EMP NAME DEPT CODE DEPT NAME Asst. Professor Rankin CHEM CIS Computer Info. Systems Chemistry PROF OFFICEKDD-567 ADV?SEE PRT-345 2873. 2765. 2238. BLF-119 3102, 2782, 3311, 2134, 2789, 3456, 1215, 2312, 3233, 2218, 2098 2008, 2876, 2222, 2002, 2046, 2018, 2901,2308 3745, 1783, 2378 2764 SPR, TRAF JCIS, JMGT PROMO, SPR DEV COMMITTEE CODE PROMO TRAF DEV MIS, QED MGT OURNAL CODE Given the information in Table 6.9: xt page before drawing the diagram. Figure P6.9a Draw the Dependency Diagram for Problem 9a
Step by Step Solution
There are 3 Steps involved in it

Get step-by-step solutions from verified subject matter experts