Question: not exactly sure how to do this Please provide detailed solutions to the following problerns/exercises (2 problemas/exercises x 7 points each): 1) The use of

not exactly sure how to do this not exactly sure how to do this Please provide
not exactly sure how to do this Please provide
Please provide detailed solutions to the following problerns/exercises (2 problemas/exercises x 7 points each): 1) The use of disposable syringes at CSI Rainy Hospital during the last 6 weeks is given below. a) Use a 3 week moving average to forecast the demand for disposable syringes for week 7. b) Use a 4 week weighted moving average (use weights of 0.1, 0.2, 0.3, and 0.4 with 0.4 being for the most recent week) to forecast the demand for disposable syringes for week 7. Use the excel templates provided (for both, moving average and weighted moving average) to forecast the demand for disposable syringes for week 7. Week Disposable Syringes Used 1 360 2 389 3 410 4 381 5 368 6 374 Note: Please use the excel templates provided (follow the instructions as given in the excel templates); these excel templates already have built-in formulas; the excel files will be your submission (you do not have to submit any other work); while working with the excel sheets if you have any issues and the excel sheets don't seem to work (e.g., maybe you deleted a cell by mistake, changed a formula by mistake, etc.), download another copy of the excel templates from BB and use the same. 2) Global Meditronic's annual sales of disposable syringes for the past 14 weeks is given below. The firm needs to forecast the demand for disposable syringes for week 15 and is considering two forecasting methods, exponential smoothing and linear regression. Use the excel templates provided for both, exponential smoothing and linear regression) to forecast the demand for disposable syringes for week 15 (while using exponential smoothing, assume any alpha level, and also assume that the forecast for week 12 was 435). Which method would you recommend for the firm and why? Week 1 2. 3 4 5 6 7 Sales (000 units) 220 245 280 275 300 310 350 Week 8 9 10 11 12 13 14 Sales (000 units) 360 400 380 420 450 460 475 Note: Please use the excel templates provided (follow the instructions as given in the excel templates); these excel templates already have built-in formulas, the excel files will be your submission (you do not have to submit any other work); while working with the excel sheets if you have any issues and the excel sheets don't

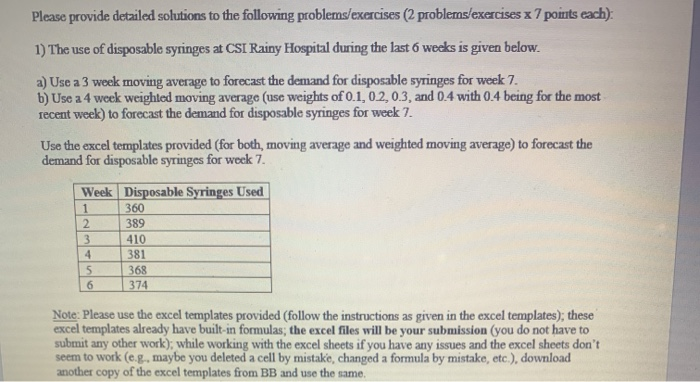
Step by Step Solution

There are 3 Steps involved in it

1 Expert Approved Answer
Step: 1 Unlock blur-text-image
Question Has Been Solved by an Expert!

Get step-by-step solutions from verified subject matter experts

Step: 2 Unlock
Step: 3 Unlock

Students Have Also Explored These Related General Management Questions!