

Question: Not flaggedFlag question Question text In reference to the Chow business plan, present a Net Present Value Analysis for the expansion of the restaurant adjacent
Not flaggedFlag question Question text In reference to the Chow business plan, present a Net Present Value Analysis for the expansion of the restaurant adjacent to its original location. You are to use capital budgeting concepts discussed this term, including but not limited to payback, return ratios (ARR, Profit Margin, ROI), and are encouraged to use the original assumptions that you specifically included in your second assignment. Marks will be awarded for the realistic nature of the figures and the depth of insight provided. When in doubt or where figures are unavailable (either in the business plan or your assignment), please identify the basis for the assumptions made.
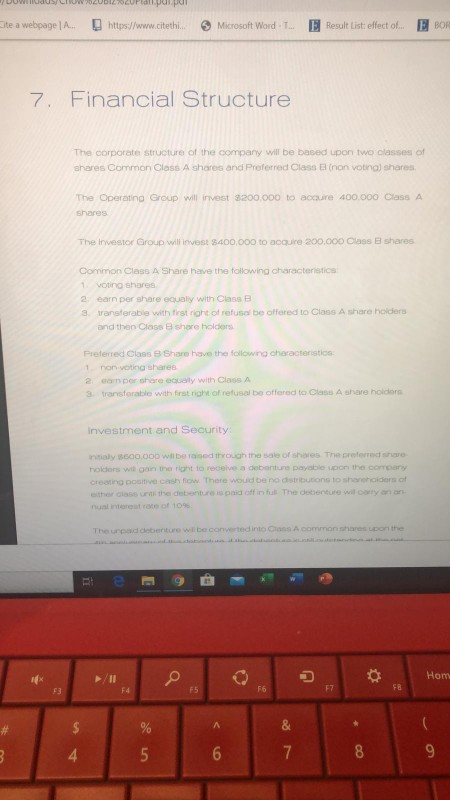
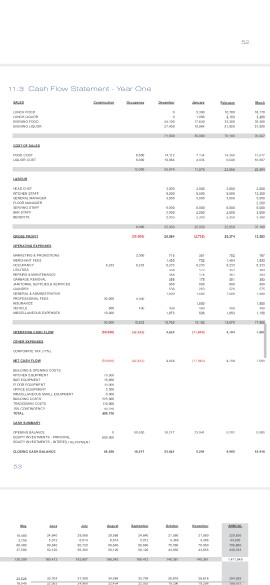
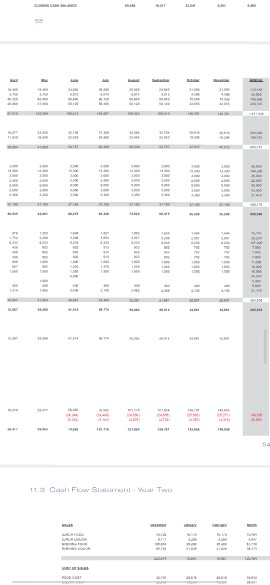

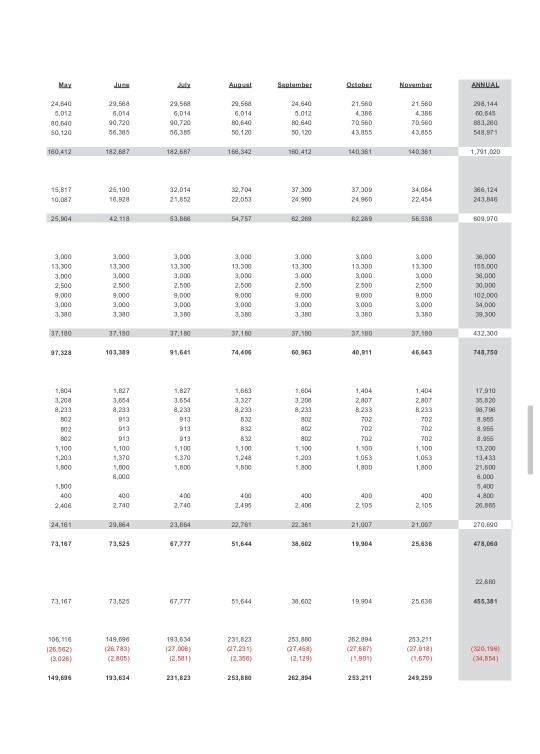
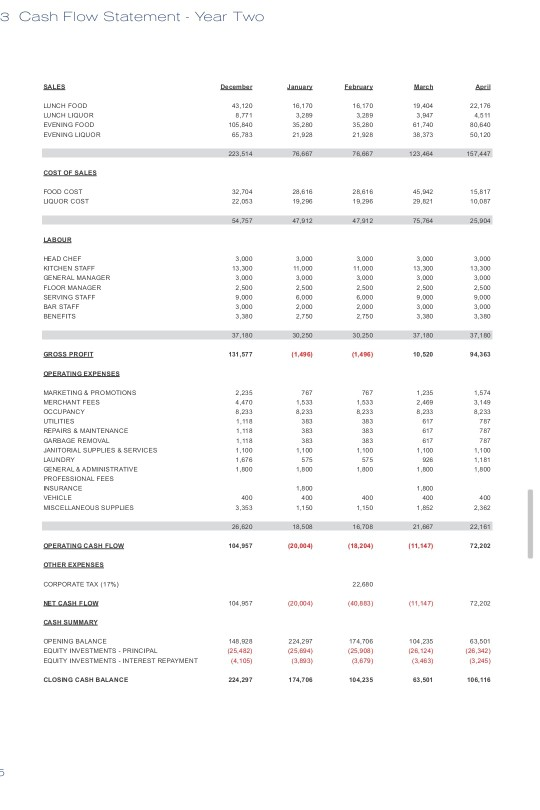
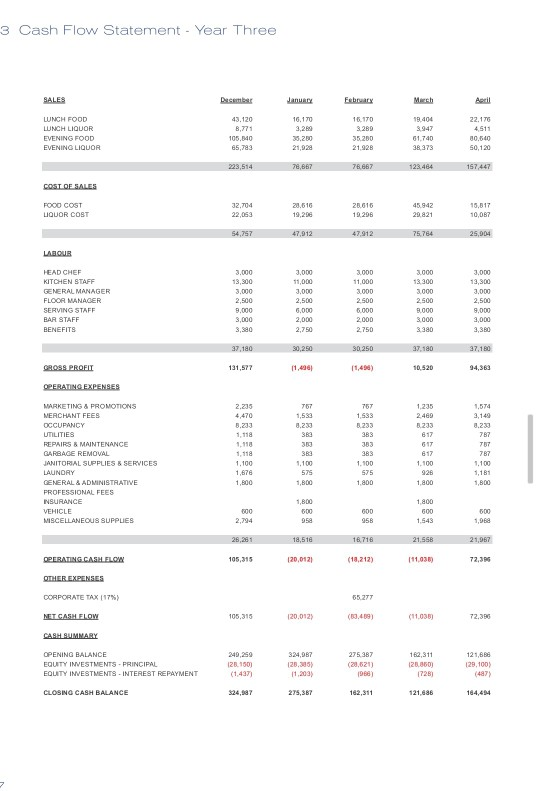
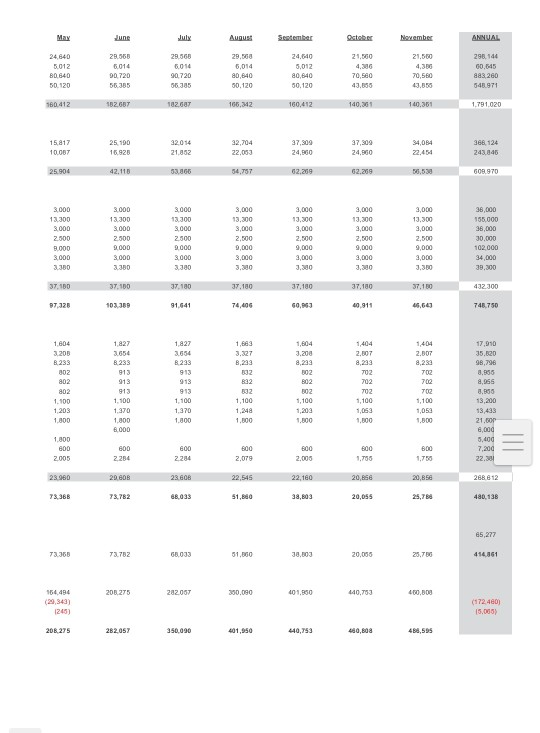
Cite a webpage A https://www.citeti Microsoft Word Result List effect of... E BOR 7. Financial Structure The corporate structure of the company will be based upon two classes of shares Common Class A shares and Preferred Class (non votina) shares The Operating Group will invest $200,000 to acquire 400.000 Class A shares The Investor Group will invest $400,000 to acquire 200,000 Class B shares Common Class A Share have the following characteristics 1 voting shares 2 earn per share equaly with Class B transferable with frist right of refuse be offered to Class A shareholders and then Class B shareholders Preferred Class B Share have the following characteristics in non voting sharon. 2 car per share outy with Class A 3 transferable with first night of refusal be offered to Class A share holders Investment and Security taly 300,000 wil be raised through the sale of shares. The preferred holders will on the right to receive a debanture payable on the company creating positive cash now. There would be no distributions to shareholders at nun retrato 10 Theunpad coberture will be converted into ans A common shares upon the o Hom F3 F4 F5 F6 F7 FB $ % A ( 3 4 5 7 8 9 11.3 Cash Flow Statement - Year One 08 i 15!! 10363 * 11.3 Cash Flow Slant Vaar Two May September October November ANNUAL 21560 24,640 3,012 80.640 50,120 29,500 6,014 90,720 56,335 29,568 6,014 90,720 56,350 29,56 6,014 B0,640 50.120 24,640 5,012 80,640 50.120 21.560 4.356 70.560 43.855 298,144 30.645 883,280 548.971 70.580 180,412 182,687 182,687 168,342 160.412 140.381 140.361 1,791,020 15,817 25,190 16,528 32,014 21,852 32,704 22.053 37.300 24.900 37,300 24,960 34.084 22.454 986, 124 243,646 10.07 25,904 42. 118 53,6 54,757 62.269 82.269 58.538 309,970 3,000 13,300 3,000 2.500 9,000 3,000 3,300 3,000 13.300 3,000 2.500 9,000 3,000 3.00 3,000 13.300 3,000 2.500 9,000 3,000 3,000 13.300 3,000 2,500 9.000 3,000 3,300 3.000 13.300 3.000 2.500 9.000 3.000 3.300 3.000 13.300 3.000 2.500 3.000 3.000 3.380 3.000 13.300 3.000 2.500 3.000 3.000 3.380 36,000 156,000 38,000 30,000 102.000 34,000 39,300 37,180 37.180 37.100 37.100 37.100 37.100 4.32.300 97,328 103.399 91,641 74,400 60,963 40,911 46.643 748,750 1404 3,054 1.604 3.200 2007 3,327 8,233 1,604 3.200 8,233 002 002 802 1.100 1,202 1,500 813 913 913 1.100 1,370 1,800 8,000 1.827 3,654 8,230 913 913 913 1.100 1,370 1,500 B32 B32 1.100 1,248 1,000 802 802 802 1.100 1.200 1.800 702 702 702 1.100 1,053 1,800 1.404 2.807 B.233 702 702 702 1,100 1053 1.000 17,910 33.820 3.796 3.950 8,955 8.955 13.200 13,40 21,500 8.000 5.400 4.800 1.800 400 2,400 400 2.740 400 2.740 400 2.490 400 2105 400 2,105 2.400 20.000 24,181 29,854 23.064 22,761 22.381 21.007 21,007 270,890 72,167 73,525 67,777 51,644 33,602 19.904 25.836 478,000 22,880 73.107 73.525 67.777 51,544 38,002 19.904 25,636 455,341 106,116 126,562) 13.028) 149.096 (28.783) (2.805) 193,634 27,008) 12.501 231,023 (27.231) 12.300) 25,800 (27,458) 12.120) 252.894 (27.687 11.901) 253.211 (27,918) (1,670) (320,196) (34,854) 149,696 193,634 221,823 253,880 262,404 259,211 249,250 3 Cash Flow Statement - Year Two SALES Jan Fy Mb AR 16. 170 LUNCH FOOD LUNCH LIQUOR EVENING FOOD EVENING LIQUOR 43,120 3.771 105,840 65,783 16,170 3.289 35,280 21,928 19,404 3,947 61,740 38,373 35.280 21,928 22,178 4.511 80 640 50,120 223,514 78,667 78.667 123,464 157,447 COST OF SALES FOOD COST LIQUOR COST 32,704 22.003 20,618 19.20 28.616 19.296 45,942 29,621 15,817 10,087 54,757 47.912 47.912 75,764 25,004 LABOUS 3,000 13,300 3.000 HEAD CHEF KITCHEN STAFF GENERAL MANAGER FLOOR MANAGER SERVING STAFF BAR STAFF BENEFITS 3,000 13,300 3,000 2,500 9.000 3,000 3.300 3,000 11,000 3,000 2,500 6.000 2,000 2.750 3.000 11,000 3,000 2.500 6.000 2000 2.750 2,500 9,000 3,000 3.30 3,000 13,300 3,000 2,500 9.000 2,000 3.380 37,180 30.250 30.250 37.100 37.100 GROSS PROFIT 131,577 11,490 10,520 94,36 OPERATING EXPENSES 767 2,235 4.470 8,233 8,233 350 382 2.469 8,233 617 MARKETING & PROMOTIONS MERCHANT FEES OCCUPANCY UTILITIES REPAIRS & MAINTENANCE GARBAGE REMOVAL JANITORAL SUPPLIES & SERVICES LAUNDRY GENERAL & ADMINISTRATIVE PROFESSIONAL FEES INSURANCE VEHICLE MISCELLANEOUS SUPPLES 1.118 1.118 1.100 1,678 1.800 787 1,533 8.233 383 383 383 1.100 575 1.000 1,574 3.149 8,233 707 787 787 1.100 1,181 1.000 1.100 575 1.000 817 1.100 926 1.500 1,000 400 3,353 400 1,150 1.800 400 1,852 400 2,362 1,150 26,620 18,500 16.708 21. 22.181 OPERATINO CASH FLOW 104,957 (20,004) (18,204 111,147) 72,202 OTHER EXPENSES CORPORATE TAX (17%) 22.600 NET CASULELOW 104.567 (20,004) (40.000) 72,202 CASH SUMMARY OPENING BALANCE EQUITY INVESTMENTS - PRINCIPAL EQUITY INVESTMENTS - INTEREST REPAYMENT 148.520 125.482) (4.105) 224,287 (25.604) 19,693) 174.705 (25.900) 2,8791 104,235 28. 124) (3.461 63,501 128,342) 13,245) CLOSING CASH BALANCE 224,207 174,700 104235 83,501 106. 110 in 3 Cash Flow Statement - Year Three SALES Desember JANUARY February March 16,170 20 LUNCH FOOD LUNCH LIQUOR EVENING FOOD EVENING LIQUOR 43,120 8.771 105,840 65,793 16.170 3.289 35.200 21,928 19.404 3.947 61,740 38.373 35,280 21,928 22,170 4.511 10.640 50,120 223,514 78,667 78.667 123.464 157,447 COST OF SALES FOOD COST LIQUOR COST 32,704 22,053 28,510 19,206 28.016 19.298 45,942 29.821 15,517 10,087 54,757 47.912 47,912 75.764 25,004 LABOUR HEAD CHEF KITCHEN STAFF GENERAL MANAGER FLOOR MANAGER SERVING STAFF BAR STAFF BENEFITS 3.000 13,300 3.000 2,500 9.000 3,000 3,380 3,000 11,000 3,000 2,500 6.000 2,000 2,750 3.000 11,000 3.000 2500 6.000 2000 2.750 3.000 13.300 3.000 2500 3.000 3.000 3.380 3.000 13,300 3.000 2,500 9,000 3,000 3,380 37.180 30,250 30 250 37.180 37,180 GROSS PROFIT 131,577 11,496 10.520 94,363 OPERATING EXPENSES 2.235 4,470 8.233 1,118 1.110 767 1,533 2,233 383 MARKETING & PROMOTIONS MERCHANT FEES OCCUPANCY UTILITIES REPAIRS & MAINTENANCE GARBAGE REMOVAL JANITORAL SUPPLIES & SERVICES LAUNDRY GENERAL & ADMINISTRATIVE PROFESSIONAL FEES INSURANCE VEHICLE MISCELLANEOUS SUPPLIES 767 1,533 5.233 383 383 383 1.100 575 1.800 1,235 2.400 8.233 817 617 617 1.100 926 1,800 1,574 3,140 2.233 787 707 787 1.100 1.100 1.676 1,800 383 1.100 575 1,800 1,800 800 2,794 1,800 600 958 000 958 1.800 600 1,543 1,968 18.510 16.710 21.558 21,967 OPERATING CASH FLOW 105,315 120,0121 72,31 OTHER EXPENSES 65.277 CORPORATE TAX [17%) NET CASH FLOW 105,315 120,012) (3.489) (11.036) 72,300 CASH SUMMARY 162,311 OPENING BALANCE EQUITY INVESTMENTS - PRINCIPAL EQUITY INVESTMENTS - INTEREST REPAYMENT 249,250 128150 (1.437) 324,987 128,305) 11.2001 275.387 (29,621) 120.860 121, 129,100) (487) CLOSING CASH BALANCE $24,987 275,367 102,311 121.686 164,454 May June Aunus! September October November ANNUAL 24,640 5.012 80.640 50.120 28.560 6014 90.720 56.385 29.500 6014 90.720 56.335 29,560 5,014 80,140 50.120 24.640 5,012 80,640 50.120 21,500 4.30 70,560 43,000 21.500 4,33 70,560 43,850 298.140 60,645 883260 548.971 180.412 182.687 182.687 165,342 160,412 140.361 140.361 1.791.020 15.817 10.00T 25.100 16,928 32014 21.852 32,704 22,053 37,300 24.10 37,500 24.0 34,014 22.454 366124 243,846 25.904 42,115 53.800 54,757 62,209 62,209 609.970 3.000 13.300 3.000 13.300 3,000 13,300 3000 3000 2.000 2.500 3.000 3.000 3.380 2.500 9.000 3.000 3.380 3.000 13,300 3.000 2.500 9.000 3.000 3.380 3,000 13,300 3,000 2.500 9,000 3,000 3,300 3,000 13,300 3.000 2,500 9,000 3,000 3,300 3,000 13,300 3,000 2,500 9,000 3,000 3.30 2.500 9,000 3,000 3,350 38,000 155.000 36,000 30.000 102.000 34,000 39.300 37.100 37.100 37.180 37.180 37.100 37.180 37,180 432.300 97,320 103,389 91.641 74,400 60,953 40,911 45,64 748.750 1,683 3.327 8,233 1,404 2.807 1.604 3.200 B.233 802 802 802 1.100 1,203 1.300 1,827 3.654 8.233 913 913 913 1.100 1,827 3.654 8.233 9:13 918 913 1.100 1,970 1.000 1,604 3.200 8,233 302 802 302 1,100 1,203 1.500 832 332 1,100 1,248 1.500 2.50 8,233 702 702 702 1,100 702 702 702 1,100 1,053 1.000 17,910 35.00 98,796 3,856 8,055 3.800 13,200 19.433 21.60p 8,000 5,400 7,200 22.30 1.099 1,500 1.800 6.000 1.300 600 2005 600 2254 600 2284 B00 2.079 800 2.000 600 1.755 B00 1.750 23.060 29.60 23.606 22,545 22,160 20,666 20,856 268.812 73.368 73.782 68.033 51,80 38,803 20,055 25,78 480,138 65,277 73.368 73.782 68,033 51.050 33,003 20,055 414861 208,275 282.067 300.090 401,850 140,753 400,000 154.494 (29,343) 1245) (172460) 15,000 208,275 282.057 350.000 401,950 440,753 400,00 480,595 Cite a webpage A https://www.citeti Microsoft Word Result List effect of... E BOR 7. Financial Structure The corporate structure of the company will be based upon two classes of shares Common Class A shares and Preferred Class (non votina) shares The Operating Group will invest $200,000 to acquire 400.000 Class A shares The Investor Group will invest $400,000 to acquire 200,000 Class B shares Common Class A Share have the following characteristics 1 voting shares 2 earn per share equaly with Class B transferable with frist right of refuse be offered to Class A shareholders and then Class B shareholders Preferred Class B Share have the following characteristics in non voting sharon. 2 car per share outy with Class A 3 transferable with first night of refusal be offered to Class A share holders Investment and Security taly 300,000 wil be raised through the sale of shares. The preferred holders will on the right to receive a debanture payable on the company creating positive cash now. There would be no distributions to shareholders at nun retrato 10 Theunpad coberture will be converted into ans A common shares upon the o Hom F3 F4 F5 F6 F7 FB $ % A ( 3 4 5 7 8 9 11.3 Cash Flow Statement - Year One 08 i 15!! 10363 * 11.3 Cash Flow Slant Vaar Two May September October November ANNUAL 21560 24,640 3,012 80.640 50,120 29,500 6,014 90,720 56,335 29,568 6,014 90,720 56,350 29,56 6,014 B0,640 50.120 24,640 5,012 80,640 50.120 21.560 4.356 70.560 43.855 298,144 30.645 883,280 548.971 70.580 180,412 182,687 182,687 168,342 160.412 140.381 140.361 1,791,020 15,817 25,190 16,528 32,014 21,852 32,704 22.053 37.300 24.900 37,300 24,960 34.084 22.454 986, 124 243,646 10.07 25,904 42. 118 53,6 54,757 62.269 82.269 58.538 309,970 3,000 13,300 3,000 2.500 9,000 3,000 3,300 3,000 13.300 3,000 2.500 9,000 3,000 3.00 3,000 13.300 3,000 2.500 9,000 3,000 3,000 13.300 3,000 2,500 9.000 3,000 3,300 3.000 13.300 3.000 2.500 9.000 3.000 3.300 3.000 13.300 3.000 2.500 3.000 3.000 3.380 3.000 13.300 3.000 2.500 3.000 3.000 3.380 36,000 156,000 38,000 30,000 102.000 34,000 39,300 37,180 37.180 37.100 37.100 37.100 37.100 4.32.300 97,328 103.399 91,641 74,400 60,963 40,911 46.643 748,750 1404 3,054 1.604 3.200 2007 3,327 8,233 1,604 3.200 8,233 002 002 802 1.100 1,202 1,500 813 913 913 1.100 1,370 1,800 8,000 1.827 3,654 8,230 913 913 913 1.100 1,370 1,500 B32 B32 1.100 1,248 1,000 802 802 802 1.100 1.200 1.800 702 702 702 1.100 1,053 1,800 1.404 2.807 B.233 702 702 702 1,100 1053 1.000 17,910 33.820 3.796 3.950 8,955 8.955 13.200 13,40 21,500 8.000 5.400 4.800 1.800 400 2,400 400 2.740 400 2.740 400 2.490 400 2105 400 2,105 2.400 20.000 24,181 29,854 23.064 22,761 22.381 21.007 21,007 270,890 72,167 73,525 67,777 51,644 33,602 19.904 25.836 478,000 22,880 73.107 73.525 67.777 51,544 38,002 19.904 25,636 455,341 106,116 126,562) 13.028) 149.096 (28.783) (2.805) 193,634 27,008) 12.501 231,023 (27.231) 12.300) 25,800 (27,458) 12.120) 252.894 (27.687 11.901) 253.211 (27,918) (1,670) (320,196) (34,854) 149,696 193,634 221,823 253,880 262,404 259,211 249,250 3 Cash Flow Statement - Year Two SALES Jan Fy Mb AR 16. 170 LUNCH FOOD LUNCH LIQUOR EVENING FOOD EVENING LIQUOR 43,120 3.771 105,840 65,783 16,170 3.289 35,280 21,928 19,404 3,947 61,740 38,373 35.280 21,928 22,178 4.511 80 640 50,120 223,514 78,667 78.667 123,464 157,447 COST OF SALES FOOD COST LIQUOR COST 32,704 22.003 20,618 19.20 28.616 19.296 45,942 29,621 15,817 10,087 54,757 47.912 47.912 75,764 25,004 LABOUS 3,000 13,300 3.000 HEAD CHEF KITCHEN STAFF GENERAL MANAGER FLOOR MANAGER SERVING STAFF BAR STAFF BENEFITS 3,000 13,300 3,000 2,500 9.000 3,000 3.300 3,000 11,000 3,000 2,500 6.000 2,000 2.750 3.000 11,000 3,000 2.500 6.000 2000 2.750 2,500 9,000 3,000 3.30 3,000 13,300 3,000 2,500 9.000 2,000 3.380 37,180 30.250 30.250 37.100 37.100 GROSS PROFIT 131,577 11,490 10,520 94,36 OPERATING EXPENSES 767 2,235 4.470 8,233 8,233 350 382 2.469 8,233 617 MARKETING & PROMOTIONS MERCHANT FEES OCCUPANCY UTILITIES REPAIRS & MAINTENANCE GARBAGE REMOVAL JANITORAL SUPPLIES & SERVICES LAUNDRY GENERAL & ADMINISTRATIVE PROFESSIONAL FEES INSURANCE VEHICLE MISCELLANEOUS SUPPLES 1.118 1.118 1.100 1,678 1.800 787 1,533 8.233 383 383 383 1.100 575 1.000 1,574 3.149 8,233 707 787 787 1.100 1,181 1.000 1.100 575 1.000 817 1.100 926 1.500 1,000 400 3,353 400 1,150 1.800 400 1,852 400 2,362 1,150 26,620 18,500 16.708 21. 22.181 OPERATINO CASH FLOW 104,957 (20,004) (18,204 111,147) 72,202 OTHER EXPENSES CORPORATE TAX (17%) 22.600 NET CASULELOW 104.567 (20,004) (40.000) 72,202 CASH SUMMARY OPENING BALANCE EQUITY INVESTMENTS - PRINCIPAL EQUITY INVESTMENTS - INTEREST REPAYMENT 148.520 125.482) (4.105) 224,287 (25.604) 19,693) 174.705 (25.900) 2,8791 104,235 28. 124) (3.461 63,501 128,342) 13,245) CLOSING CASH BALANCE 224,207 174,700 104235 83,501 106. 110 in 3 Cash Flow Statement - Year Three SALES Desember JANUARY February March 16,170 20 LUNCH FOOD LUNCH LIQUOR EVENING FOOD EVENING LIQUOR 43,120 8.771 105,840 65,793 16.170 3.289 35.200 21,928 19.404 3.947 61,740 38.373 35,280 21,928 22,170 4.511 10.640 50,120 223,514 78,667 78.667 123.464 157,447 COST OF SALES FOOD COST LIQUOR COST 32,704 22,053 28,510 19,206 28.016 19.298 45,942 29.821 15,517 10,087 54,757 47.912 47,912 75.764 25,004 LABOUR HEAD CHEF KITCHEN STAFF GENERAL MANAGER FLOOR MANAGER SERVING STAFF BAR STAFF BENEFITS 3.000 13,300 3.000 2,500 9.000 3,000 3,380 3,000 11,000 3,000 2,500 6.000 2,000 2,750 3.000 11,000 3.000 2500 6.000 2000 2.750 3.000 13.300 3.000 2500 3.000 3.000 3.380 3.000 13,300 3.000 2,500 9,000 3,000 3,380 37.180 30,250 30 250 37.180 37,180 GROSS PROFIT 131,577 11,496 10.520 94,363 OPERATING EXPENSES 2.235 4,470 8.233 1,118 1.110 767 1,533 2,233 383 MARKETING & PROMOTIONS MERCHANT FEES OCCUPANCY UTILITIES REPAIRS & MAINTENANCE GARBAGE REMOVAL JANITORAL SUPPLIES & SERVICES LAUNDRY GENERAL & ADMINISTRATIVE PROFESSIONAL FEES INSURANCE VEHICLE MISCELLANEOUS SUPPLIES 767 1,533 5.233 383 383 383 1.100 575 1.800 1,235 2.400 8.233 817 617 617 1.100 926 1,800 1,574 3,140 2.233 787 707 787 1.100 1.100 1.676 1,800 383 1.100 575 1,800 1,800 800 2,794 1,800 600 958 000 958 1.800 600 1,543 1,968 18.510 16.710 21.558 21,967 OPERATING CASH FLOW 105,315 120,0121 72,31 OTHER EXPENSES 65.277 CORPORATE TAX [17%) NET CASH FLOW 105,315 120,012) (3.489) (11.036) 72,300 CASH SUMMARY 162,311 OPENING BALANCE EQUITY INVESTMENTS - PRINCIPAL EQUITY INVESTMENTS - INTEREST REPAYMENT 249,250 128150 (1.437) 324,987 128,305) 11.2001 275.387 (29,621) 120.860 121, 129,100) (487) CLOSING CASH BALANCE $24,987 275,367 102,311 121.686 164,454 May June Aunus! September October November ANNUAL 24,640 5.012 80.640 50.120 28.560 6014 90.720 56.385 29.500 6014 90.720 56.335 29,560 5,014 80,140 50.120 24.640 5,012 80,640 50.120 21,500 4.30 70,560 43,000 21.500 4,33 70,560 43,850 298.140 60,645 883260 548.971 180.412 182.687 182.687 165,342 160,412 140.361 140.361 1.791.020 15.817 10.00T 25.100 16,928 32014 21.852 32,704 22,053 37,300 24.10 37,500 24.0 34,014 22.454 366124 243,846 25.904 42,115 53.800 54,757 62,209 62,209 609.970 3.000 13.300 3.000 13.300 3,000 13,300 3000 3000 2.000 2.500 3.000 3.000 3.380 2.500 9.000 3.000 3.380 3.000 13,300 3.000 2.500 9.000 3.000 3.380 3,000 13,300 3,000 2.500 9,000 3,000 3,300 3,000 13,300 3.000 2,500 9,000 3,000 3,300 3,000 13,300 3,000 2,500 9,000 3,000 3.30 2.500 9,000 3,000 3,350 38,000 155.000 36,000 30.000 102.000 34,000 39.300 37.100 37.100 37.180 37.180 37.100 37.180 37,180 432.300 97,320 103,389 91.641 74,400 60,953 40,911 45,64 748.750 1,683 3.327 8,233 1,404 2.807 1.604 3.200 B.233 802 802 802 1.100 1,203 1.300 1,827 3.654 8.233 913 913 913 1.100 1,827 3.654 8.233 9:13 918 913 1.100 1,970 1.000 1,604 3.200 8,233 302 802 302 1,100 1,203 1.500 832 332 1,100 1,248 1.500 2.50 8,233 702 702 702 1,100 702 702 702 1,100 1,053 1.000 17,910 35.00 98,796 3,856 8,055 3.800 13,200 19.433 21.60p 8,000 5,400 7,200 22.30 1.099 1,500 1.800 6.000 1.300 600 2005 600 2254 600 2284 B00 2.079 800 2.000 600 1.755 B00 1.750 23.060 29.60 23.606 22,545 22,160 20,666 20,856 268.812 73.368 73.782 68.033 51,80 38,803 20,055 25,78 480,138 65,277 73.368 73.782 68,033 51.050 33,003 20,055 414861 208,275 282.067 300.090 401,850 140,753 400,000 154.494 (29,343) 1245) (172460) 15,000 208,275 282.057 350.000 401,950 440,753 400,00 480,595
Step by Step Solution
There are 3 Steps involved in it

Get step-by-step solutions from verified subject matter experts