Question: Not solve or change anything Just paste on paper with better handwriting. Please fast as possible. Thank you so much Use black and blue (black
Not solve or change anything
Just paste on paper with better handwriting. Please fast as possible. Thank you so much
Use black and blue (black for headings)
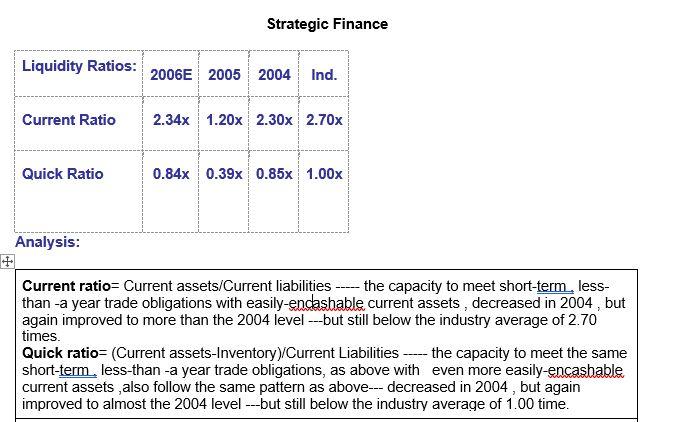
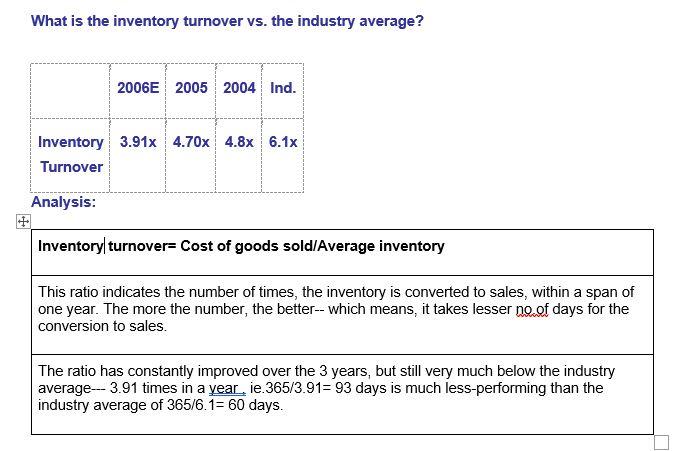
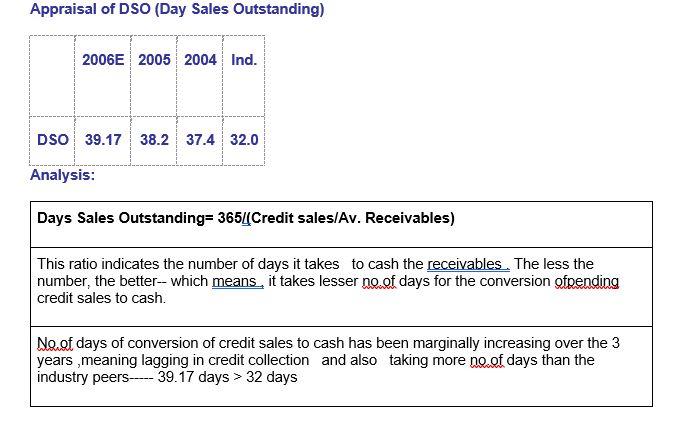
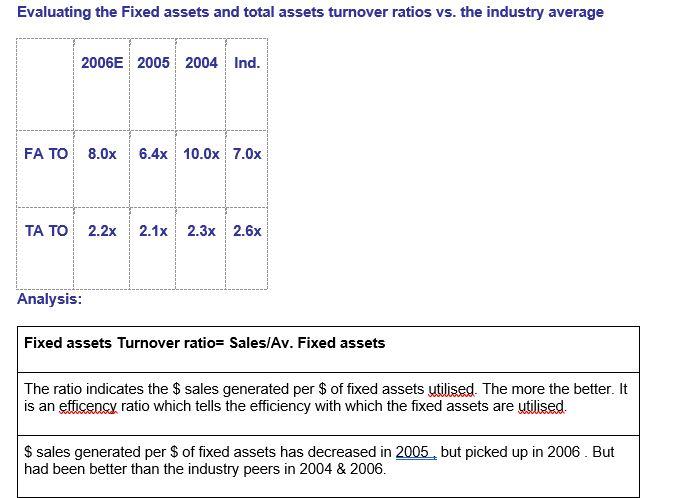
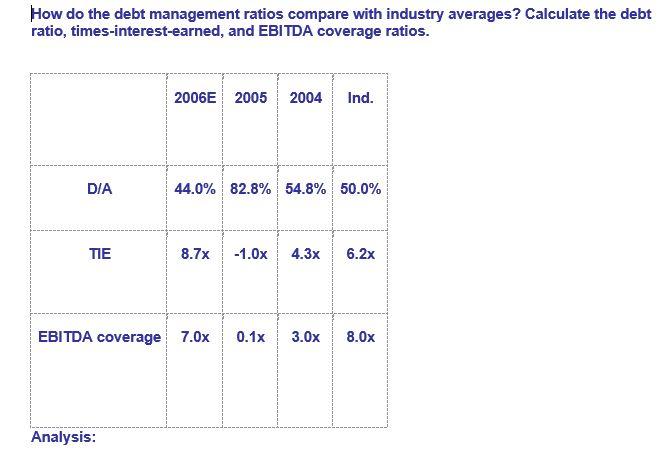
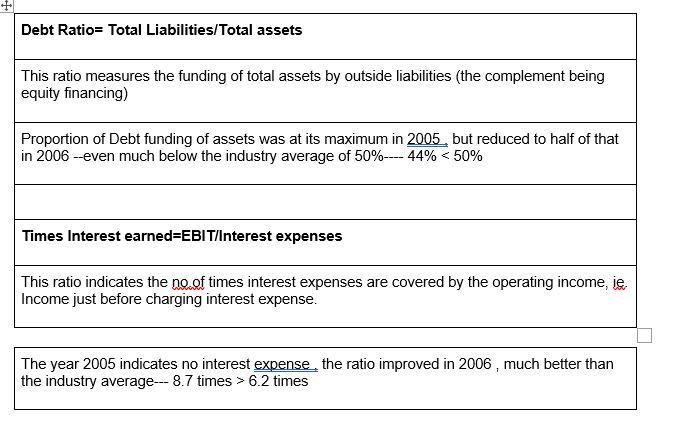
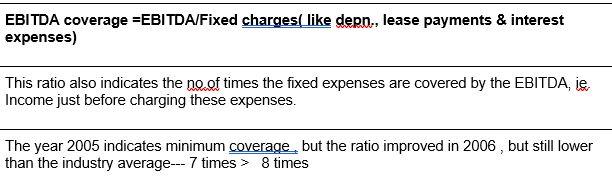
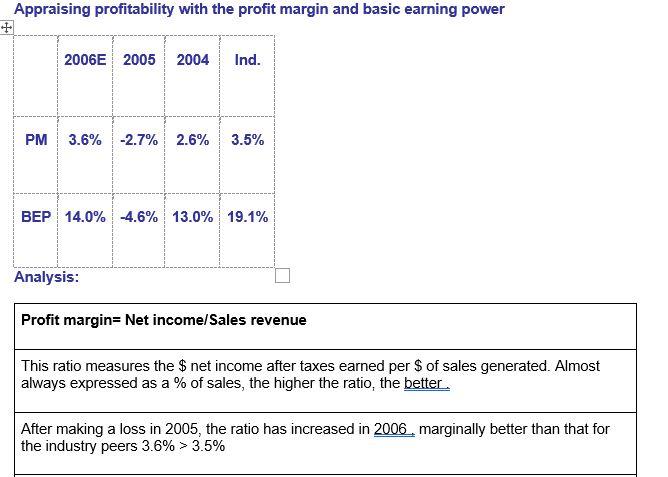
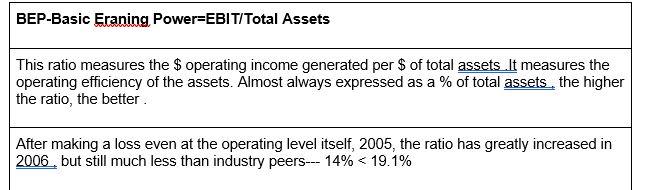
Strategic Finance Liquidity Ratios: 2006 2005 2004 Ind. Current Ratio 2.34x 1.20x 2.30x 2.70x Quick Ratio 0.84x 0.39x 0.85x 1.00x Analysis: Current ratio= Current assets/Current liabilities ----- the capacity to meet short-term, less- than -a year trade obligations with easily-encashable current assets , decreased in 2004 , but again improved to more than the 2004 level ---but still below the industry average of 2.70 times. Quick ratio= (Current assets-Inventory)/Current Liabilities ---- the capacity to meet the same short-term less-than-a year trade obligations, as above with even more easily-encashable current assets also follow the same pattern as above--- decreased in 2004, but again improved to almost the 2004 level ---but still below the industry average of 1.00 time. What is the inventory turnover vs. the industry average? 2006E 2005 2004 Ind. Inventory 3.91x 4.70x 4.8x 6.1x Turnover Analysis: Inventory turnover= Cost of goods sold/Average inventory This ratio indicates the number of times, the inventory is converted to sales, within a span of one year. The more the number, the better-- which means, it takes lesser no.of days for the conversion to sales. The ratio has constantly improved over the 3 years, but still very much below the industry average--- 3.91 times in a year, ie. 365/3.91= 93 days is much less-performing than the industry average of 365/6.1= 60 days. Appraisal of DSO (Day Sales Outstanding) 2006 2005 2004 Ind. DSO 39.17 38.2 37.4 32.0 Analysis: Days Sales Outstanding= 365(Credit sales/Av. Receivables) This ratio indicates the number of days it takes to cash the receivables. The less the number, the better-- which means, it takes lesser no.of days for the conversion ofpending credit sales to cash. No.of days of conversion of credit sales to cash has been marginally increasing over the 3 years meaning lagging in credit collection and also taking more ne.of days than the industry peers---- 39.17 days > 32 days Evaluating the Fixed assets and total assets turnover ratios vs. the industry average 2006E 2005 2004 Ind. FA TO 8.0x 6.4x 10.0x 7.0x TA TO 2.2x 2.1x 2.3x 2.6x Analysis: Fixed assets Turnover ratio= Sales/Av. Fixed assets The ratio indicates the $ sales generated per $ of fixed assets utilised. The more the better. It is an efficency ratio which tells the efficiency with which the fixed assets are utilised $ sales generated per $ of fixed assets has decreased in 2005, but picked up in 2006. But had been better than the industry peers in 2004 & 2006. Total assets Turnover ratio= Sales/Av. Total assets The ratio indicates the $ sales generated per $ of total assets utilised. The more the better. It is an efficency ratio which tells the efficiency with which the total assets are utilised. $ sales generated per $ of total assets marginally decreased in 2005, but picked up in 2006. But had been less than the industry peers in all the 3 years. How do the debt management ratios compare with industry averages? Calculate the debt ratio, times-interest-earned, and EBITDA coverage ratios. 2006 2005 2004 Ind. DIA 44.0% 82.8% 54.8% 50.0% TIE 8.7x -1.0x 4.3x 6.2x EBITDA coverage 7.0x 0.1x 3.0x 8.Ox Analysis: Debt Ratio= Total Liabilities/Total assets This ratio measures the funding of total assets by outside liabilities (the complement being equity financing) Proportion of Debt funding of assets was at its maximum in 2005, but reduced to half of that in 2006 --even much below the industry average of 50%---- 44% 6.2 times EBITDA coverage =EBITDA/Fixed charges(like dern., lease payments & interest expenses) This ratio also indicates the no. of times the fixed expenses are covered by the EBITDA, ie Income just before charging these expenses. The year 2005 indicates minimum coverage, but the ratio improved in 2006, but still lower than the industry average--- 7 times > 8 times Appraising profitability with the profit margin and basic earning power 2006 2005 2004 Ind. PM 3.6% -2.7% 2.6% 3.5% BEP 14.0% -4.6% 13.0% 19.1% Analysis: Profit margin= Net income/Sales revenue This ratio measures the $ net income after taxes earned per $ of sales generated. Almost always expressed as a % of sales, the higher the ratio, the better. After making a loss in 2005, the ratio has increased in 2006, marginally better than that for the industry peers 3.6% > 3.5% BEP-Basic Eraning Power=EBIT/Total Assets This ratio measures the $ operating income generated per $ of total assets. It measures the operating efficiency of the assets. Almost always expressed as a % of total assets, the higher the ratio, the better After making a loss even at the operating level itself, 2005, the ratio has greatly increased in 2006, but still much less than industry peers--- 14%


