

Question: not sure how to do Intro The following table shows historical beginning-of-year prices for two stocks 1 Year Stock A Stock B 39.7 578.11 37.77
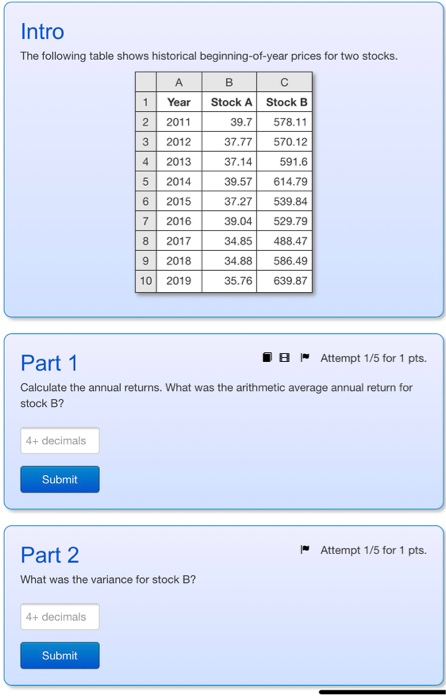
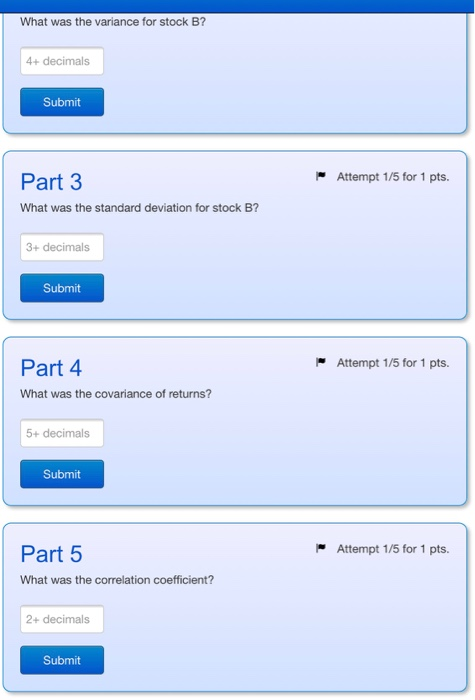
Intro The following table shows historical beginning-of-year prices for two stocks 1 Year Stock A Stock B 39.7 578.11 37.77 570.12 4 2013 7.4 591.6 39.57 614.79 37.27539.84 72016 39.04 529.79 34.85 488.47 34.88 586.49 10 2019 35.76 639.87 2 2011 5 2014 6 2015 8 2017 9 2018 Part 1 B Attempt 1/5 for 1 pts Calculate the annual returns. What was the arithmetic average annual return for stock B? + decimals Submit Part 2 Attempt 1/5 for 1 pts What was the variance for stock B? 4+ decimals Submit What was the variance for stock B? 4+ decimals Submit Part 3 What was the standard deviation for stock B Attempt 1/5 for 1 pts. 3+ decimals Submit Part 4 Attempt 1/5 for 1 pts. What was the covariance of returns? 5+ decimals Submit Part 5 Attempt 1/5 for 1 pts. What was the correlation coefficient? 2+ decimals Submit
Step by Step Solution
There are 3 Steps involved in it

Get step-by-step solutions from verified subject matter experts