

Question: not sure how to plot new graph, both pages are for one question. Page |4 1.6 Further #4: This time series graph describes the spread
not sure how to plot new graph, both pages are for one question.
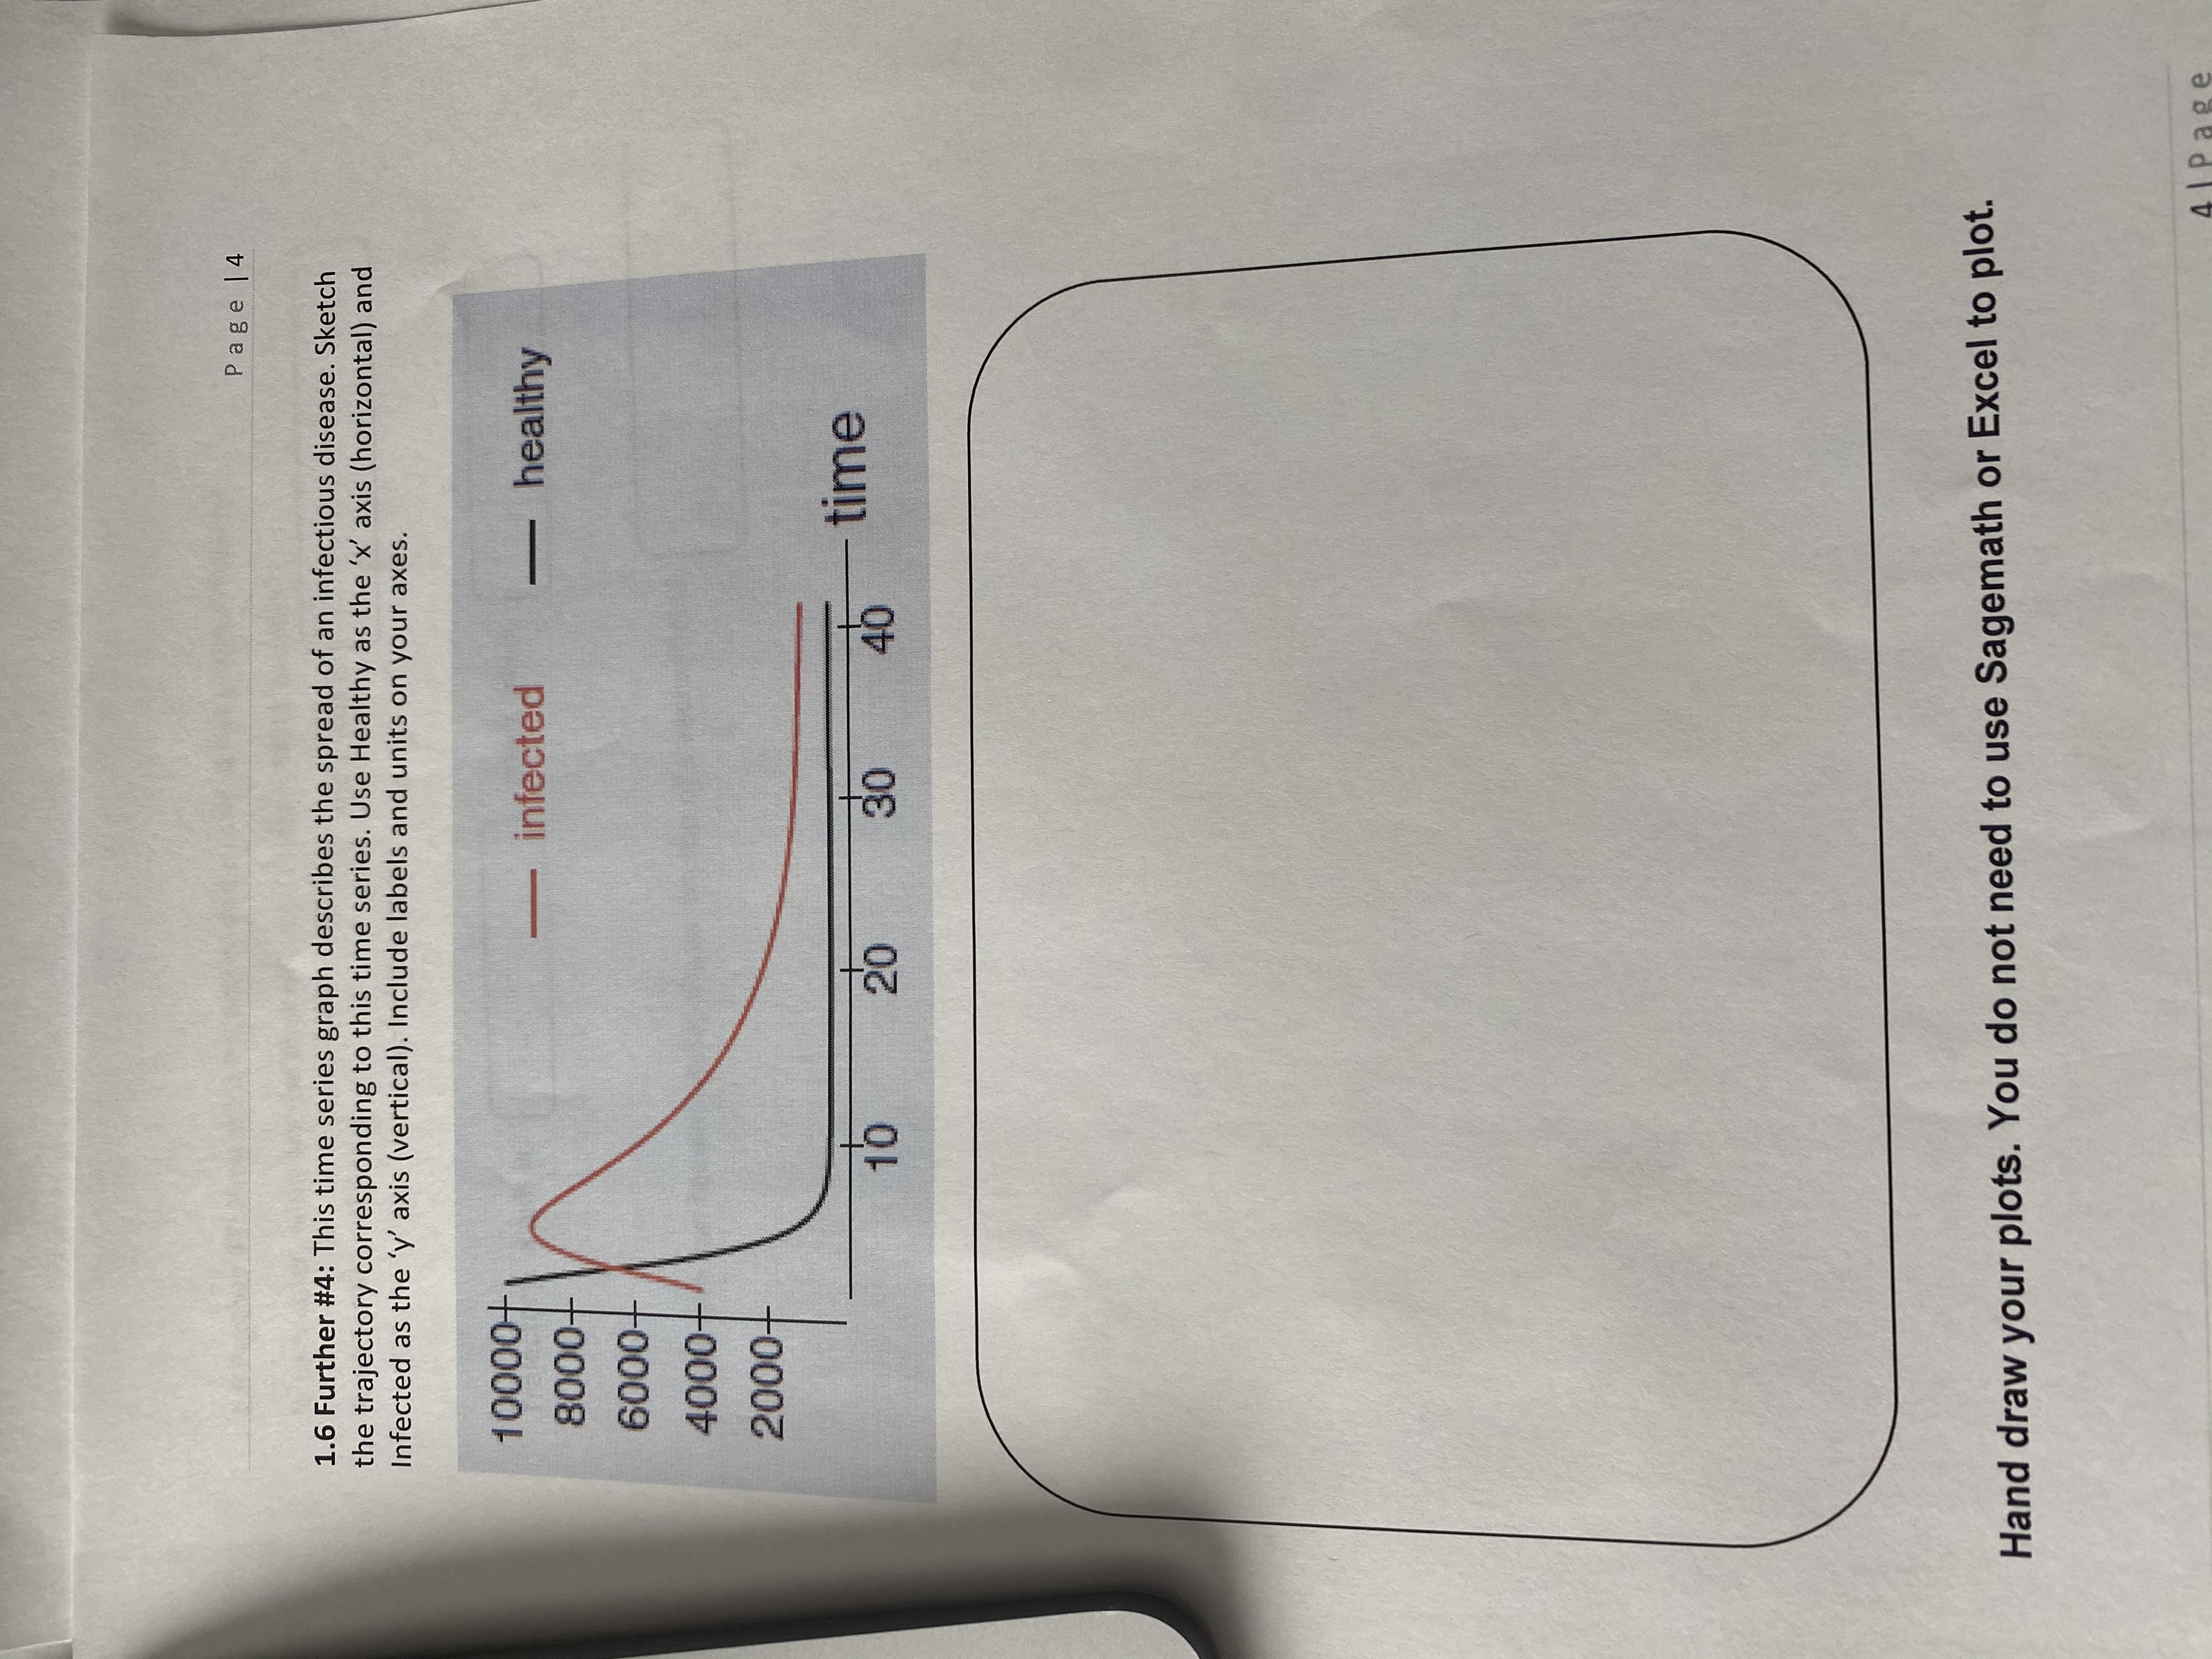
Page |4 1.6 Further #4: This time series graph describes the spread of an infectious disease. Sketch the trajectory corresponding to this time series. Use Healthy as the 'x' axis (horizontal) and Infected as the 'y' axis (vertical). Include labels and units on your axes. 10000+ 8000- infected - healthy 6000+ 4000+ 2000+ 10 20 30 40 time Hand draw your plots. You do not need to use Sagemath or Excel to plot.Page | 6 Page 15 1.6 Further #7: How are a trajectory and a time series graph different? In particular, what are the axes of each? (Time?, State variable?) Time series: x axis is and y axis is Trajectory: x axis is and y axis is Which one can reasonably be drawn on top of a vector field
Step by Step Solution
There are 3 Steps involved in it

Get step-by-step solutions from verified subject matter experts